Publication
Metrics
AI Quick Summary
This paper explores the utility of linked micromaps for evidence-based policy by comparing them to traditional geographic data displays. It demonstrates their effectiveness in visualizing relationships and distributions of statistics linked to US states and Washington, DC, using data from the Bureau of Labor Statistics, the Census Bureau, and the Economic Research Service.
Paper Preview
Abstract
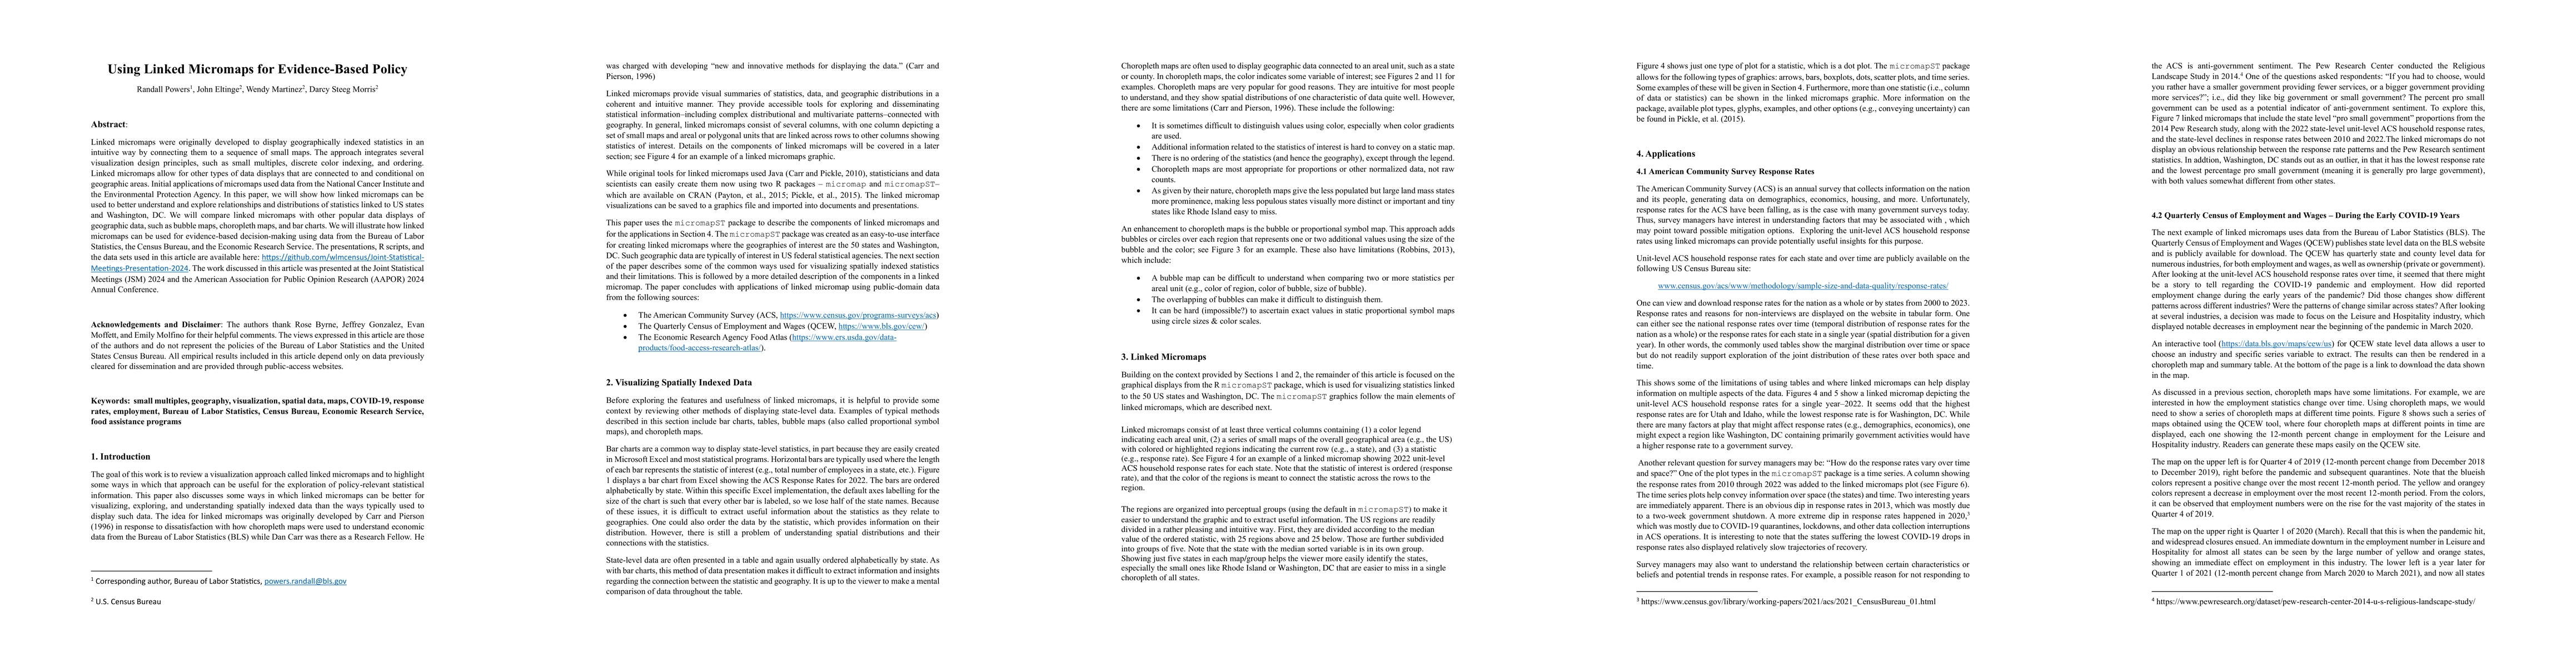
Linked micromaps were originally developed to display geographically indexed statistics in an intuitive way by connecting them to a sequence of small maps. The approach integrates several visualization design principles, such as small multiples, discrete color indexing, and ordering. Linked micromaps allow for other types of data displays that are connected to and conditional on geographic areas. Initial applications of micromaps used data from the National Cancer Institute and the Environmental Protection Agency. In this paper, we will show how linked micromaps can be used to better understand and explore relationships and distributions of statistics linked to US states and Washington, DC. We will compare linked micromaps with other popular data displays of geographic data, such as bubble maps, choropleth maps, and bar charts. We will illustrate how linked micromaps can be used for evidence-based decision-making using data from the Bureau of Labor Statistics, the Census Bureau, and the Economic Research Service. The presentations, R scripts, and the data sets used in this article are available here: https://github.com/wlmcensus/Joint-Statistical-Meetings-Presentation-2024. The work discussed in this article was presented at the Joint Statistical Meetings (JSM) 2024 and the American Association for Public Opinion Research (AAPOR) 2024 Annual Conference.
AI Key Findings
Get AI-generated insights about this paper's methodology, results, significance, and more — seven facets brought into focus.
Paper Details
Authors
PDF Preview
Related Papers
No references found for this paper.
Discussion 0