Using RuleBuilder to graphically define and visualize BioNetGen-language patterns and reaction rules
Publication
Metrics
Paper Preview
Abstract
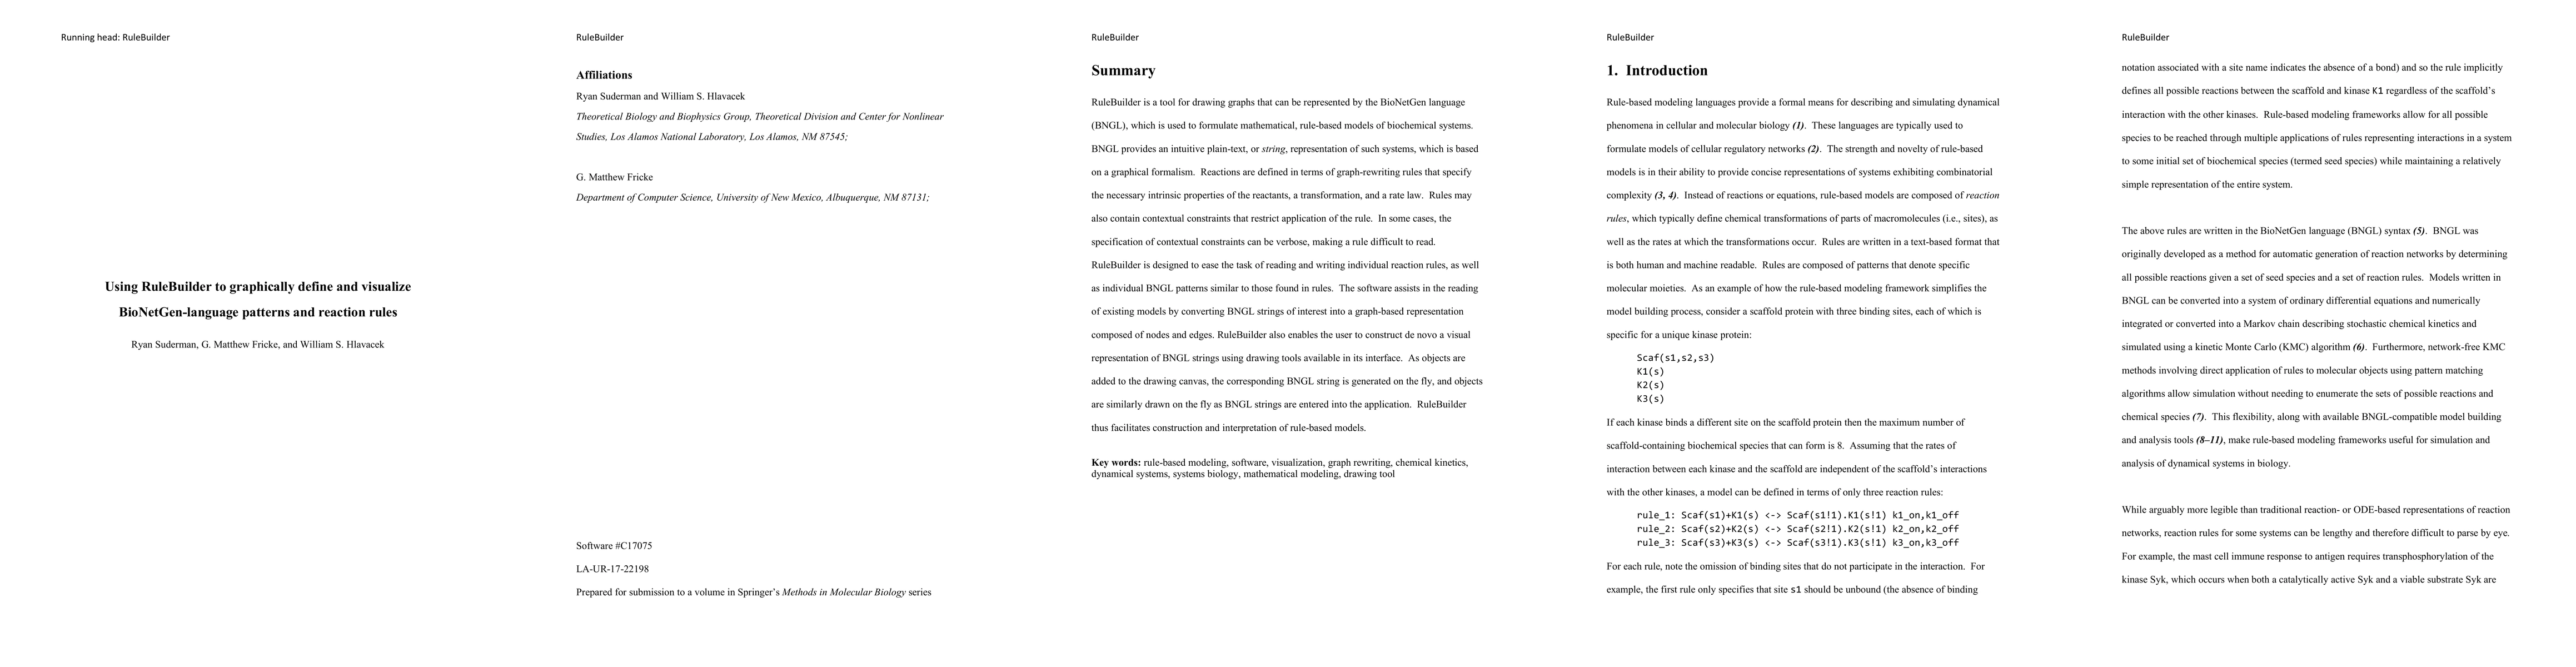
RuleBuilder is a tool for drawing graphs that can be represented by the BioNetGen language (BNGL), which is used to formulate mathematical, rule-based models of biochemical systems. BNGL provides an intuitive plain-text, or string, representation of such systems, which is based on a graphical formalism. Reactions are defined in terms of graph-rewriting rules that specify the necessary intrinsic properties of the reactants, a transformation, and a rate law. Rules may also contain contextual constraints that restrict application of the rule. In some cases, the specification of contextual constraints can be verbose, making a rule difficult to read. RuleBuilder is designed to ease the task of reading and writing individual reaction rules, as well as individual BNGL patterns similar to those found in rules. The software assists in the reading of existing models by converting BNGL strings of interest into a graph-based representation composed of nodes and edges. RuleBuilder also enables the user to construct de novo a visual representation of BNGL strings using drawing tools available in its interface. As objects are added to the drawing canvas, the corresponding BNGL string is generated on the fly, and objects are similarly drawn on the fly as BNGL strings are entered into the application. RuleBuilder thus facilitates construction and interpretation of rule-based models.
AI Key Findings
Get AI-generated insights about this paper's methodology, results, significance, and more — seven facets brought into focus.
Impact
Paper Details
PDF Preview
Key Terms
Citation Network
Current paper (gray), citations (green), references (blue)
Display is limited for performance on very large graphs.
Discussion 0