Publication
Metrics
Quick Actions
Paper Preview
Abstract
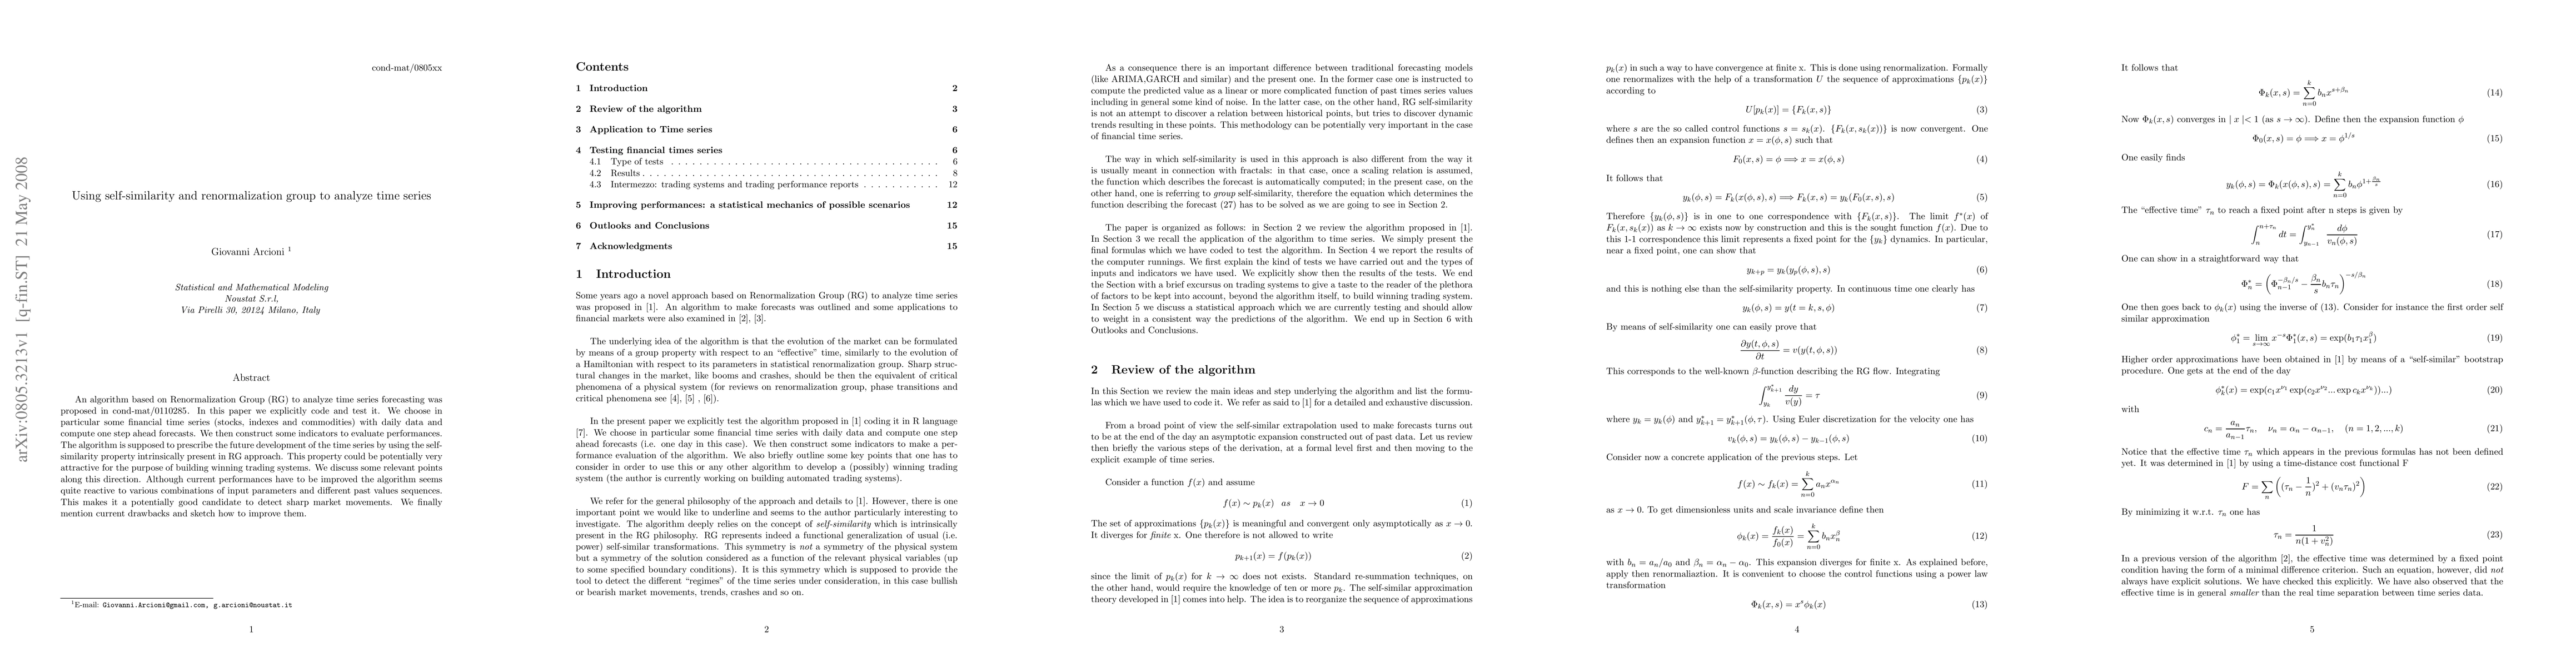
An algorithm based on Renormalization Group (RG) to analyze time series forecasting was proposed in cond-mat/0110285. In this paper we explicitly code and test it. We choose in particular some financial time series (stocks, indexes and commodities) with daily data and compute one step ahead forecasts. We then construct some indicators to evaluate performances. The algorithm is supposed to prescribe the future development of the time series by using the self-similarity property intrinsically present in RG approach. This property could be potentially very attractive for the purpose of building winning trading systems. We discuss some relevant points along this direction. Although current performances have to be improved the algorithm seems quite reactive to various combinations of input parameters and different past values sequences. This makes it a potentially good candidate to detect sharp market movements. We finally mention current drawbacks and sketch how to improve them.
AI Key Findings
Get AI-generated insights about this paper's methodology, results, and significance.
Paper Details
How to Cite This Paper
@article{anon2008using,
  title         = {Using self-similarity and renormalization group to analyze time series},
  year          = {2008},
  eprint        = {0805.3213},
  archivePrefix = {arXiv},
  primaryClass  = {q-fin.ST},
}(2008). Using self-similarity and renormalization group to analyze time series. arXiv. https://arxiv.org/abs/0805.3213"Using self-similarity and renormalization group to analyze time series." arXiv, 2008, arxiv.org/abs/0805.3213.PDF Preview
Key Terms
Citation Network
Current paper (gray), citations (green), references (blue)
Display is limited for performance on very large graphs.
Similar Papers
Found 4 papersA similarity renormalization group approach to Green's function methods
Pierre-François Loos, Antoine Marie
| Title | Authors | Year | Actions |
|---|
Comments (0)