Using Tableau and Google Map API for Understanding the Impact of Walkability on Dublin City
Publication
Metrics
AI Quick Summary
This paper employs Tableau and Google Map API to visualize and quantify walkability in Dublin city, assessing its impact on house prices through WLS regression. The study highlights the economic importance of walkable areas by identifying less walkable regions and correlating them with property values.
Paper Preview
Abstract
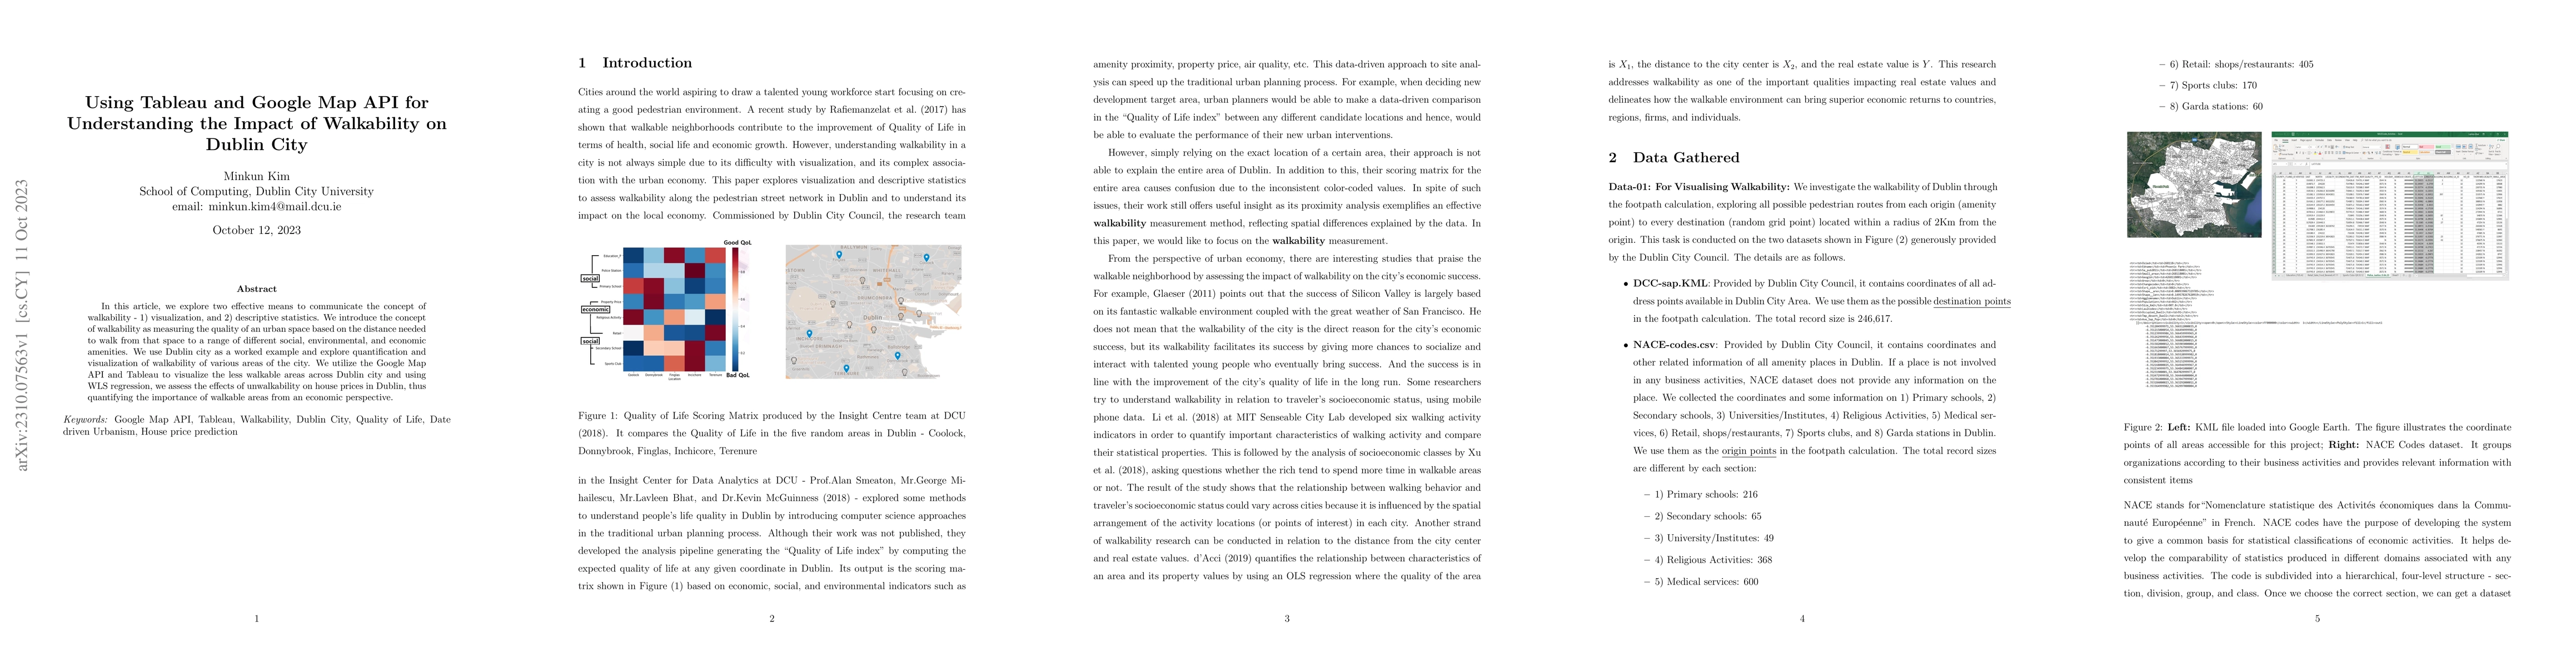
In this article, we explore two effective means to communicate the concept of walkability - 1) visualization, and 2) descriptive statistics. We introduce the concept of walkability as measuring the quality of an urban space based on the distance needed to walk from that space to a range of different social, environmental, and economic amenities. We use Dublin city as a worked example and explore quantification and visualization of walkability of various areas of the city. We utilize the Google Map API and Tableau to visualize the less walkable areas across Dublin city and using WLS regression, we assess the effects of unwalkability on house prices in Dublin, thus quantifying the importance of walkable areas from an economic perspective.
AI Key Findings
Get AI-generated insights about this paper's methodology, results, significance, and more — seven facets brought into focus.
Impact
Paper Details
Authors
PDF Preview
Key Terms
Citation Network
Current paper (gray), citations (green), references (blue)
Display is limited for performance on very large graphs.
Discussion 0