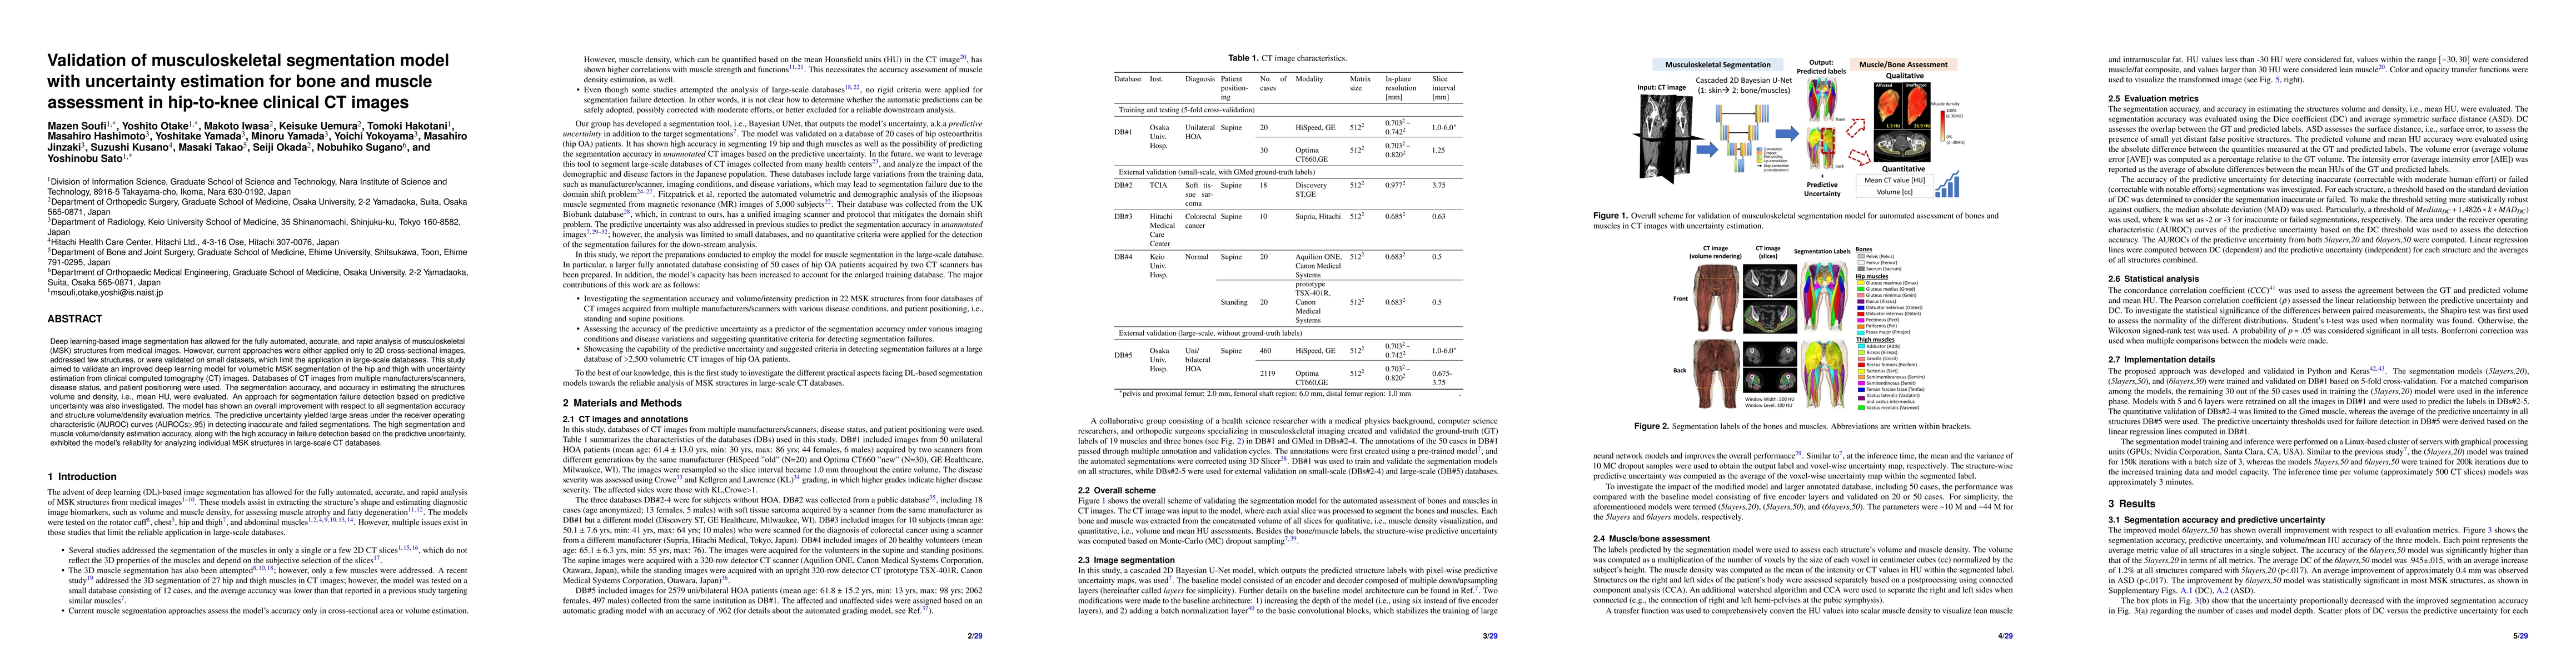
Summary
Deep learning-based image segmentation has allowed for the fully automated, accurate, and rapid analysis of musculoskeletal (MSK) structures from medical images. However, current approaches were either applied only to 2D cross-sectional images, addressed few structures, or were validated on small datasets, which limit the application in large-scale databases. This study aimed to validate an improved deep learning model for volumetric MSK segmentation of the hip and thigh with uncertainty estimation from clinical computed tomography (CT) images. Databases of CT images from multiple manufacturers/scanners, disease status, and patient positioning were used. The segmentation accuracy, and accuracy in estimating the structures volume and density, i.e., mean HU, were evaluated. An approach for segmentation failure detection based on predictive uncertainty was also investigated. The model has shown an overall improvement with respect to all segmentation accuracy and structure volume/density evaluation metrics. The predictive uncertainty yielded large areas under the receiver operating characteristic (AUROC) curves (AUROCs>=.95) in detecting inaccurate and failed segmentations. The high segmentation and muscle volume/density estimation accuracy, along with the high accuracy in failure detection based on the predictive uncertainty, exhibited the model's reliability for analyzing individual MSK structures in large-scale CT databases.
AI Key Findings
Get AI-generated insights about this paper's methodology, results, and significance.
Paper Details
PDF Preview
Citation Network
Current paper (gray), citations (green), references (blue)
Display is limited for performance on very large graphs.
Similar Papers
Found 4 papersFully-automated deep learning slice-based muscle estimation from CT images for sarcopenia assessment
No citations found for this paper.
Comments (0)