Publication
Metrics
AI Quick Summary
This study investigates the time variability of Mg II and Al III absorption lines in 22 Low Ionization Broad Absorption Line Quasars (LoBAL QSOs) over timescales ranging from 10 days to 7.69 years. Long-term variability is observed in 36% of cases, while short-term variability is less common. The findings suggest that highly variable LoBAL QSOs tend to have high ejection velocities and low redshifts, with implications for understanding the physical distinctions between different BAL QSO sub-classes.
Paper Preview
Abstract
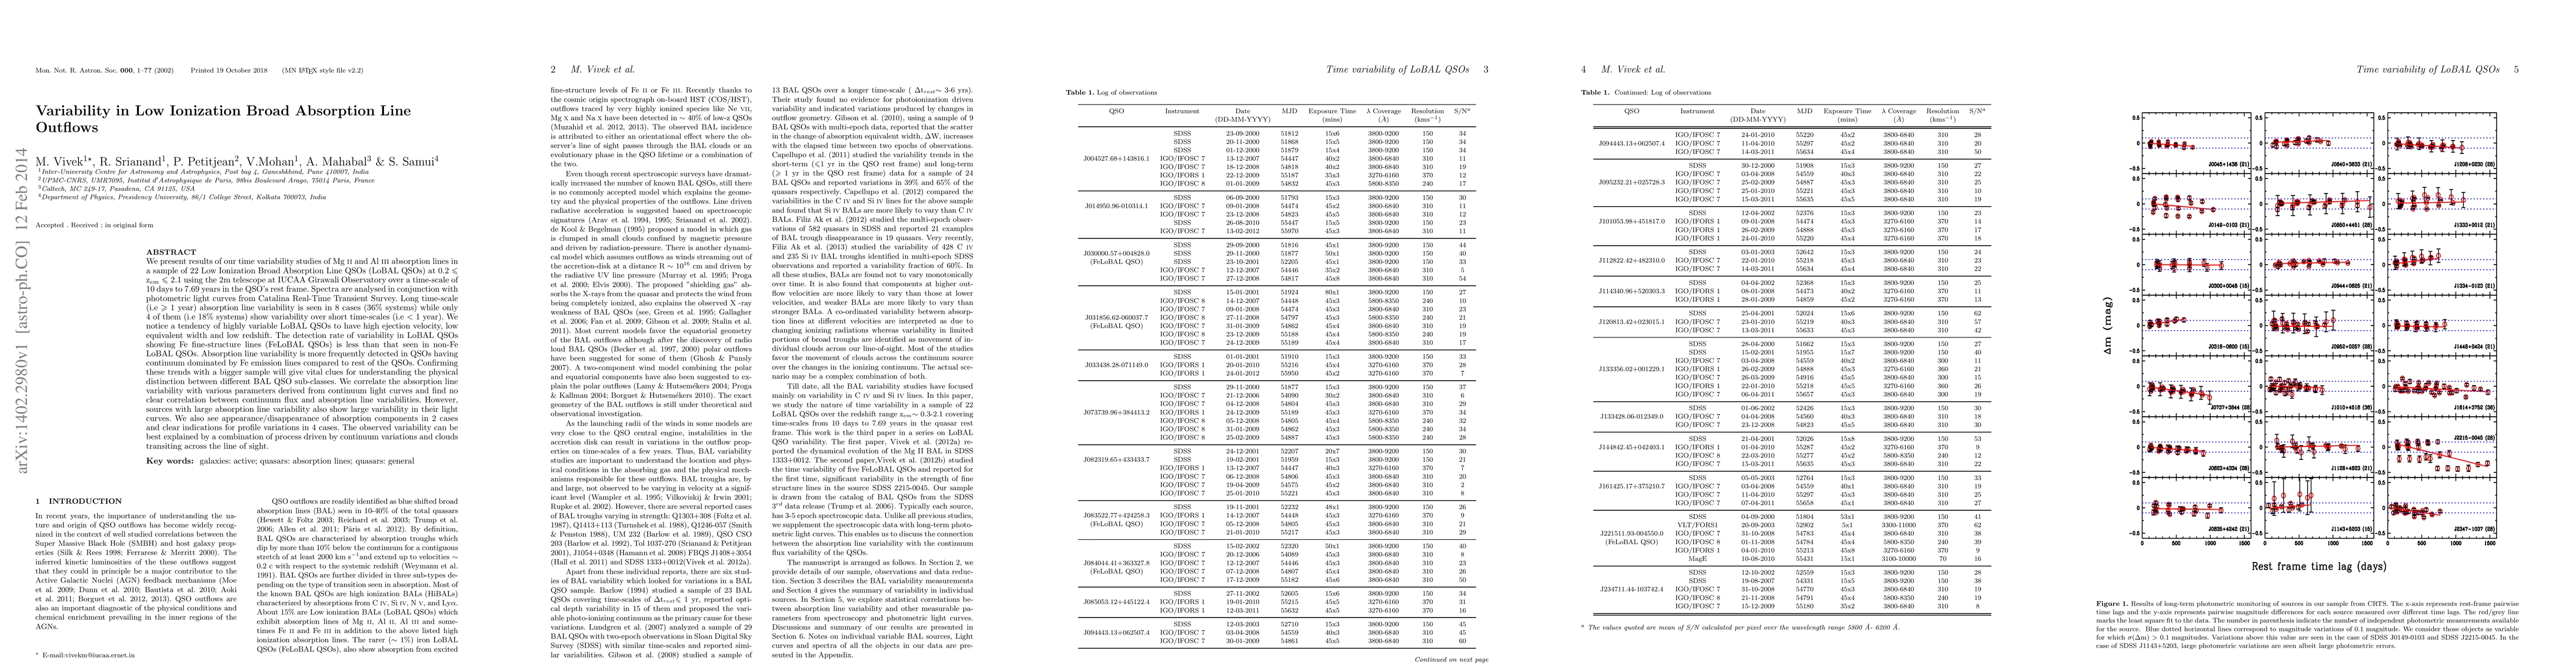
We present results of our time variability studies of Mg II and Al III absorption lines in a sample of 22 Low Ionization Broad Absorption Line QSOs (LoBAL QSOs) at 0.2 <= zem <= 2.1 using the 2m telescope at IUCAA Girawali Observatory over a time-scale of 10 days to 7.69 years in the QSO's rest frame. Spectra are analysed in conjunction with photometric light curves from Catalina Real-Time Transient Survey. Long time-scale (i.e >= 1 year) absorption line variability is seen in 8 cases (36% systems) while only 4 of them (i.e 18% systems) show variability over short time-scales (i.e < 1 year). We notice a tendency of highly variable LoBAL QSOs to have high ejection velocity, low equivalent width and low redshift. The detection rate of variability in LoBAL QSOs showing Fe fine-structure lines (FeLoBAL QSOs) is less than that seen in non-Fe LoBAL QSOs. Absorption line variability is more frequently detected in QSOs having continuum dominated by Fe emission lines compared to rest of the QSOs. Confirming these trends with a bigger sample will give vital clues for understanding the physical distinction between different BAL QSO sub-classes. We correlate the absorption line variability with various parameters derived from continuum light curves and find no clear correlation between continuum flux and absorption line variabilities. However, sources with large absorption line variability also show large variability in their light curves. We also see appearance/disappearance of absorption components in 2 cases and clear indications for profile variations in 4 cases. The observed variability can be best explained by a combination of process driven by continuum variations and clouds transiting across the line of sight.
AI Key Findings
Get AI-generated insights about this paper's methodology, results, significance, and more — seven facets brought into focus.
Impact
Paper Details
PDF Preview
Key Terms
Citation Network
Current paper (gray), citations (green), references (blue)
Display is limited for performance on very large graphs.
Discussion 0