Variable Importance Clouds: A Way to Explore Variable Importance for the Set of Good Models
Publication
Metrics
AI Quick Summary
This paper introduces the concept of a variable importance cloud to explore variable importance across multiple well-performing predictive models, rather than relying on a single model. It visualizes variable importance through importance diagrams, demonstrating the variability in importance across models using real-world datasets.
Paper Preview
Abstract
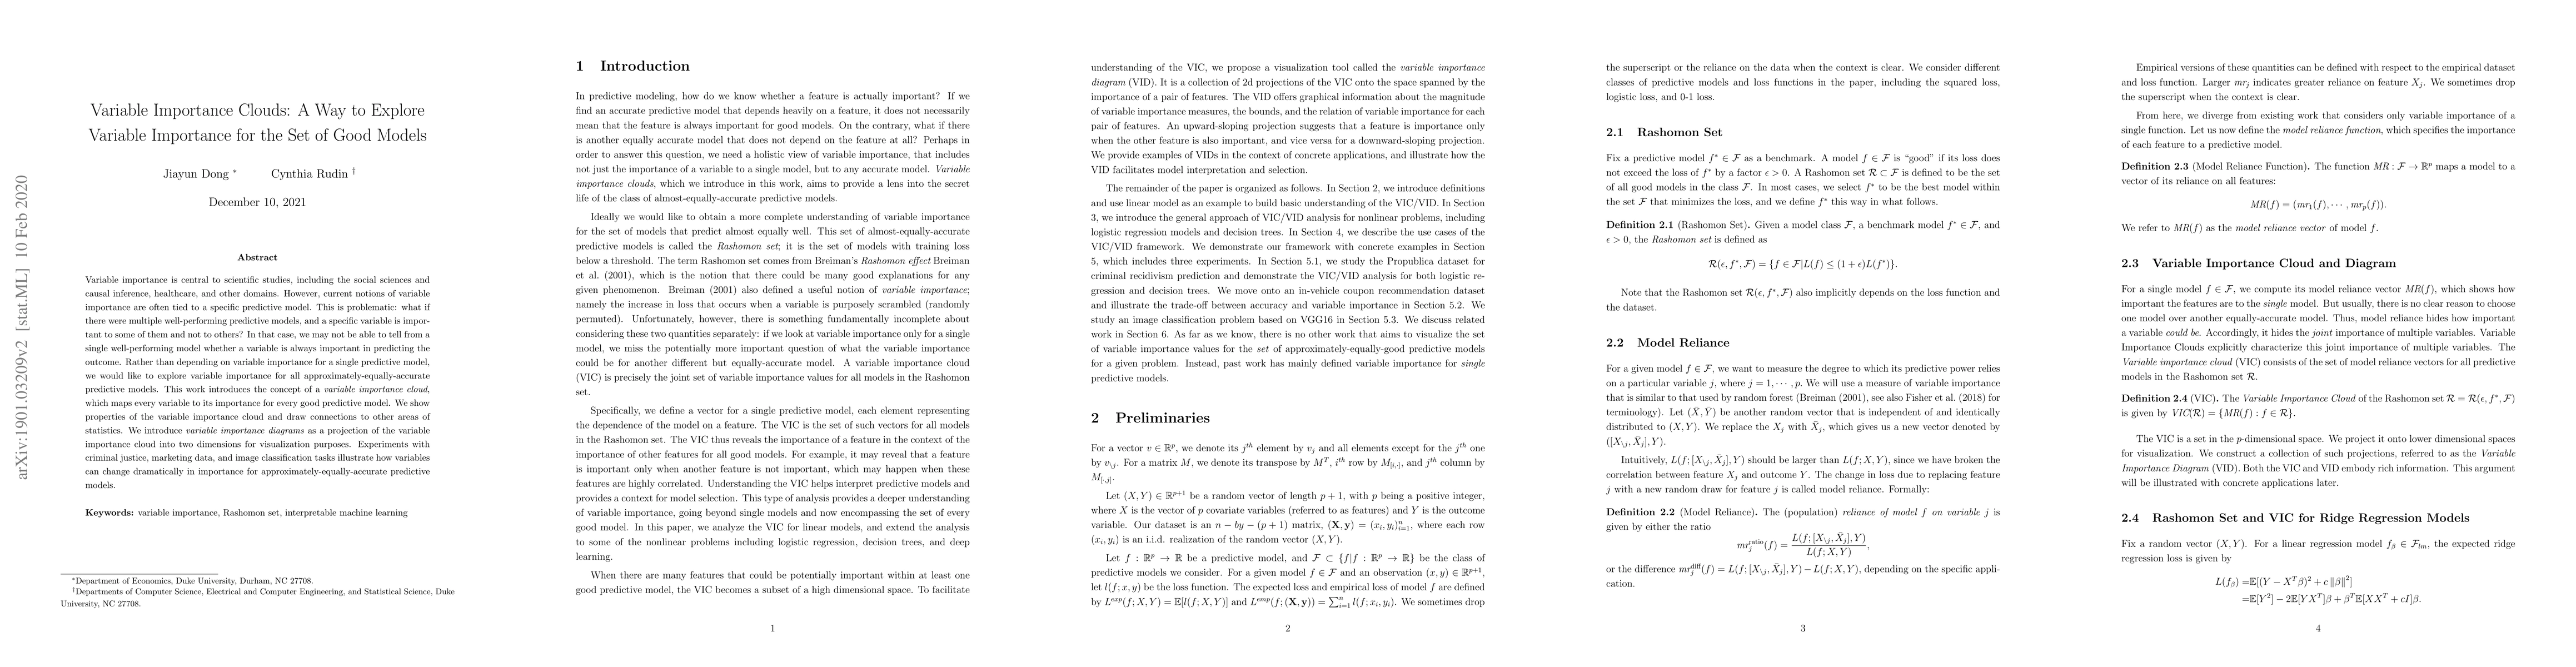
Variable importance is central to scientific studies, including the social sciences and causal inference, healthcare, and other domains. However, current notions of variable importance are often tied to a specific predictive model. This is problematic: what if there were multiple well-performing predictive models, and a specific variable is important to some of them and not to others? In that case, we may not be able to tell from a single well-performing model whether a variable is always important in predicting the outcome. Rather than depending on variable importance for a single predictive model, we would like to explore variable importance for all approximately-equally-accurate predictive models. This work introduces the concept of a variable importance cloud, which maps every variable to its importance for every good predictive model. We show properties of the variable importance cloud and draw connections to other areas of statistics. We introduce variable importance diagrams as a projection of the variable importance cloud into two dimensions for visualization purposes. Experiments with criminal justice, marketing data, and image classification tasks illustrate how variables can change dramatically in importance for approximately-equally-accurate predictive models
AI Key Findings
Get AI-generated insights about this paper's methodology, results, significance, and more — seven facets brought into focus.
Impact
Paper Details
PDF Preview
Key Terms
Citation Network
Current paper (gray), citations (green), references (blue)
Display is limited for performance on very large graphs.
Discussion 0