Publication
Metrics
AI Quick Summary
This paper introduces a novel method for analyzing time-course gene set expression in RNA-seq data, offering a model-free approach that efficiently detects longitudinal changes without assuming specific distributions. The proposed method, tcgsaseq, demonstrates improved stability and power compared to existing methods, making it a valuable addition to the statistical toolkit for RNA-seq analysis.
Paper Preview
Abstract
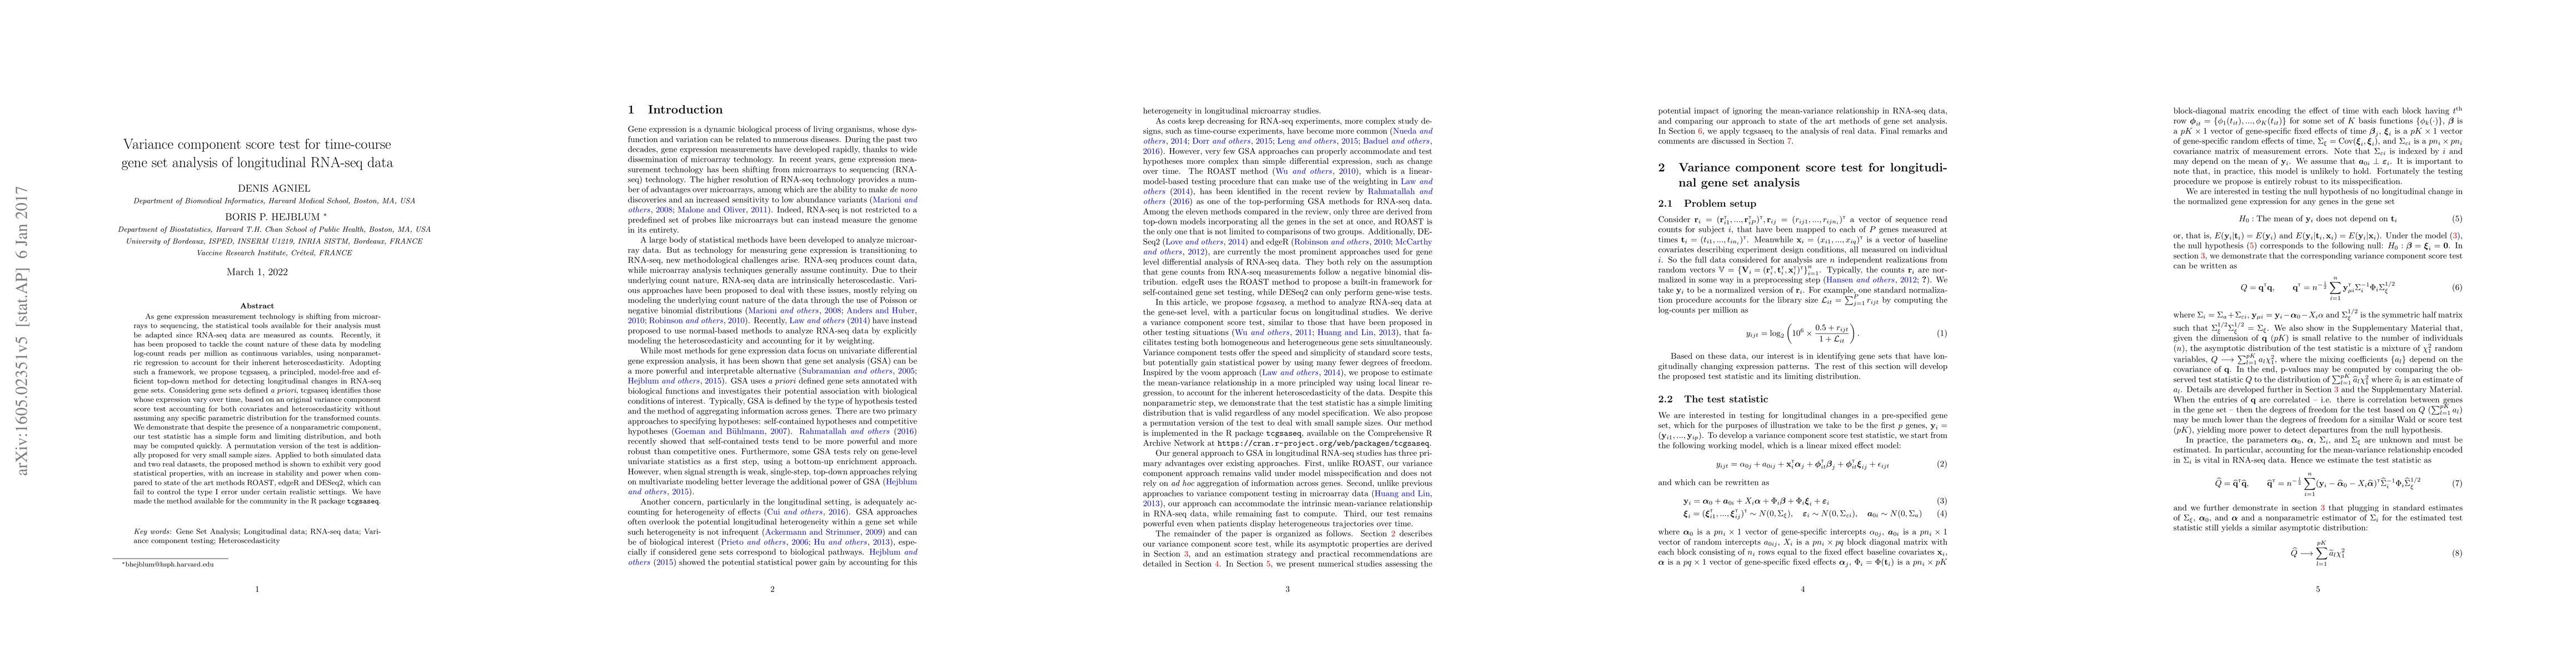
As gene expression measurement technology is shifting from microarrays to sequencing, the statistical tools available for their analysis must be adapted since RNA-seq data are measured as counts. Recently, it has been proposed to tackle the count nature of these data by modeling log-count reads per million as continuous variables, using nonparametric regression to account for their inherent heteroscedasticity. Adopting such a framework, we propose tcgsaseq, a principled, model-free and efficient top-down method for detecting longitudinal changes in RNA-seq gene sets. Considering gene sets defined a priori, tcgsaseq identifies those whose expression vary over time, based on an original variance component score test accounting for both covariates and heteroscedasticity without assuming any specific parametric distribution for the transformed counts. We demonstrate that despite the presence of a nonparametric component, our test statistic has a simple form and limiting distribution, and both may be computed quickly. A permutation version of the test is additionally proposed for very small sample sizes. Applied to both simulated data and two real datasets, the proposed method is shown to exhibit very good statistical properties, with an increase in stability and power when compared to state of the art methods ROAST, edgeR and DESeq2, which can fail to control the type I error under certain realistic settings. We have made the method available for the community in the R package tcgsaseq.
AI Key Findings
Get AI-generated insights about this paper's methodology, results, significance, and more — seven facets brought into focus.
Impact
Paper Details
Authors
PDF Preview
Key Terms
Citation Network
Current paper (gray), citations (green), references (blue)
Display is limited for performance on very large graphs.
Discussion 0