Variational Autoencoder Generative Adversarial Network for Synthetic Data Generation in Smart Home
Publication
Metrics
AI Quick Summary
This paper proposes a Variational AutoEncoder Generative Adversarial Network (VAE-GAN) to generate synthetic smart grid data, addressing data availability issues. The model outperforms vanilla GANs in generating realistic electrical load and PV production data, as evidenced by lower KL divergence, MMD, and Wasserstein distance, and closer alignment in statistical parameters.
Paper Preview
Abstract
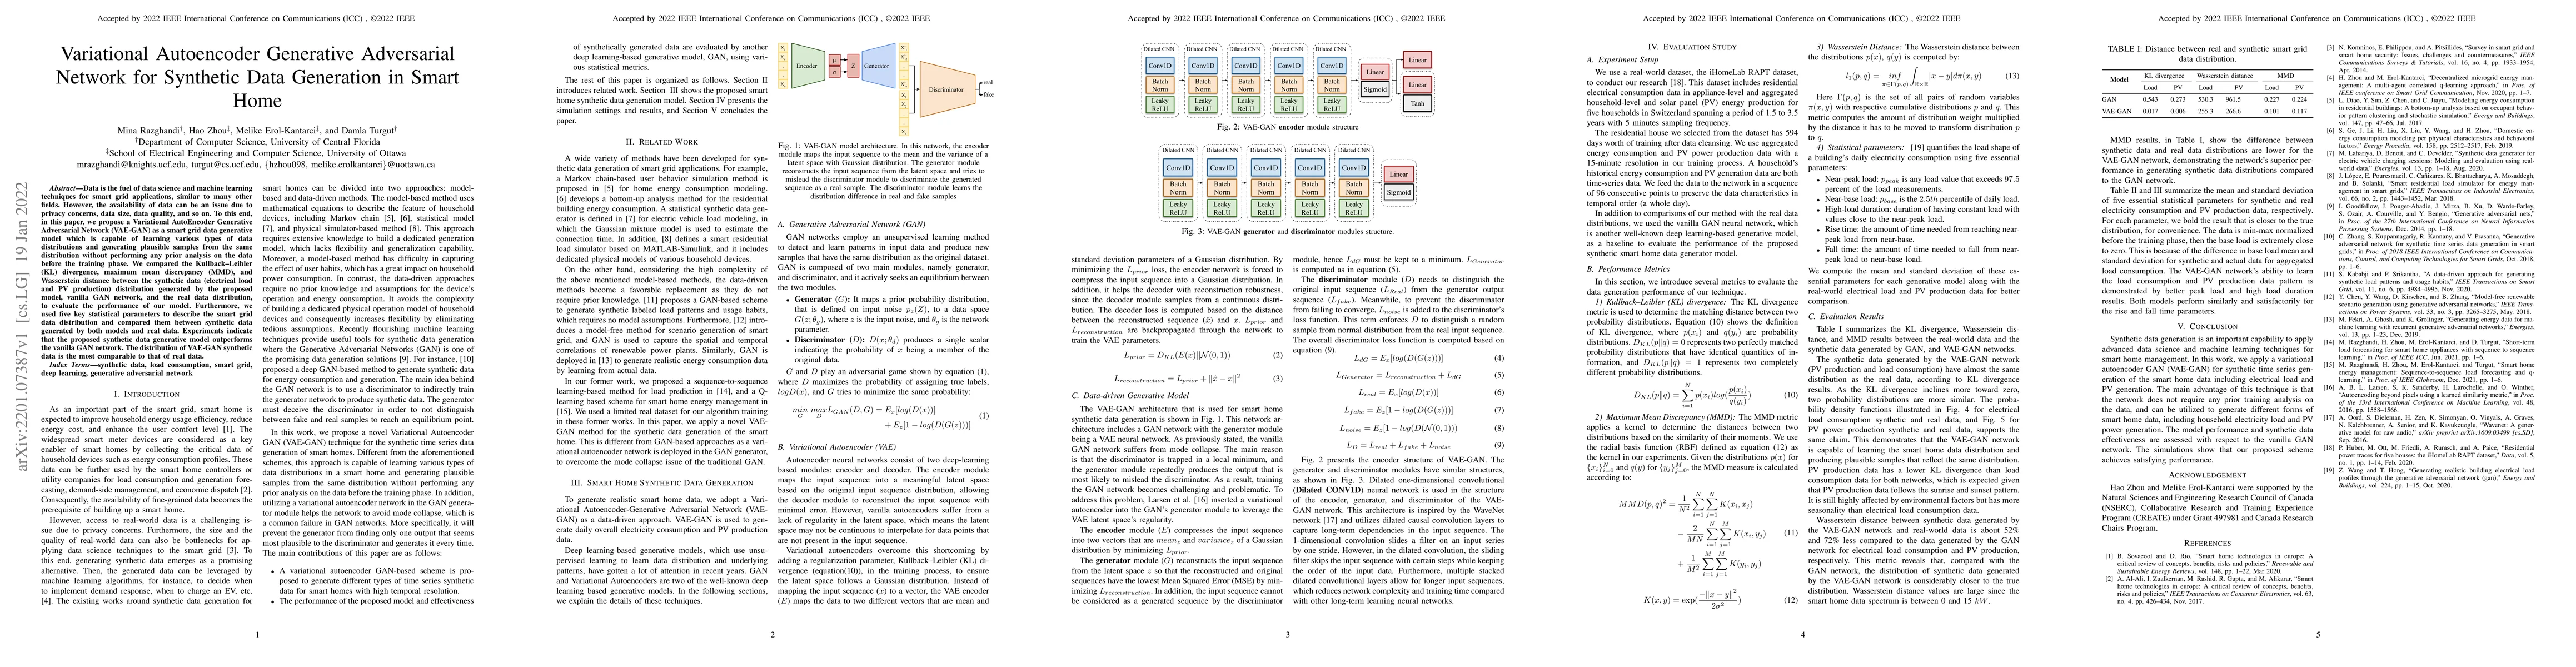
Data is the fuel of data science and machine learning techniques for smart grid applications, similar to many other fields. However, the availability of data can be an issue due to privacy concerns, data size, data quality, and so on. To this end, in this paper, we propose a Variational AutoEncoder Generative Adversarial Network (VAE-GAN) as a smart grid data generative model which is capable of learning various types of data distributions and generating plausible samples from the same distribution without performing any prior analysis on the data before the training phase.We compared the Kullback-Leibler (KL) divergence, maximum mean discrepancy (MMD), and Wasserstein distance between the synthetic data (electrical load and PV production) distribution generated by the proposed model, vanilla GAN network, and the real data distribution, to evaluate the performance of our model. Furthermore, we used five key statistical parameters to describe the smart grid data distribution and compared them between synthetic data generated by both models and real data. Experiments indicate that the proposed synthetic data generative model outperforms the vanilla GAN network. The distribution of VAE-GAN synthetic data is the most comparable to that of real data.
AI Key Findings
Get AI-generated insights about this paper's methodology, results, significance, and more — seven facets brought into focus.
Impact
Paper Details
Authors
PDF Preview
Key Terms
Citation Network
Current paper (gray), citations (green), references (blue)
Display is limited for performance on very large graphs.
Discussion 0