Summary
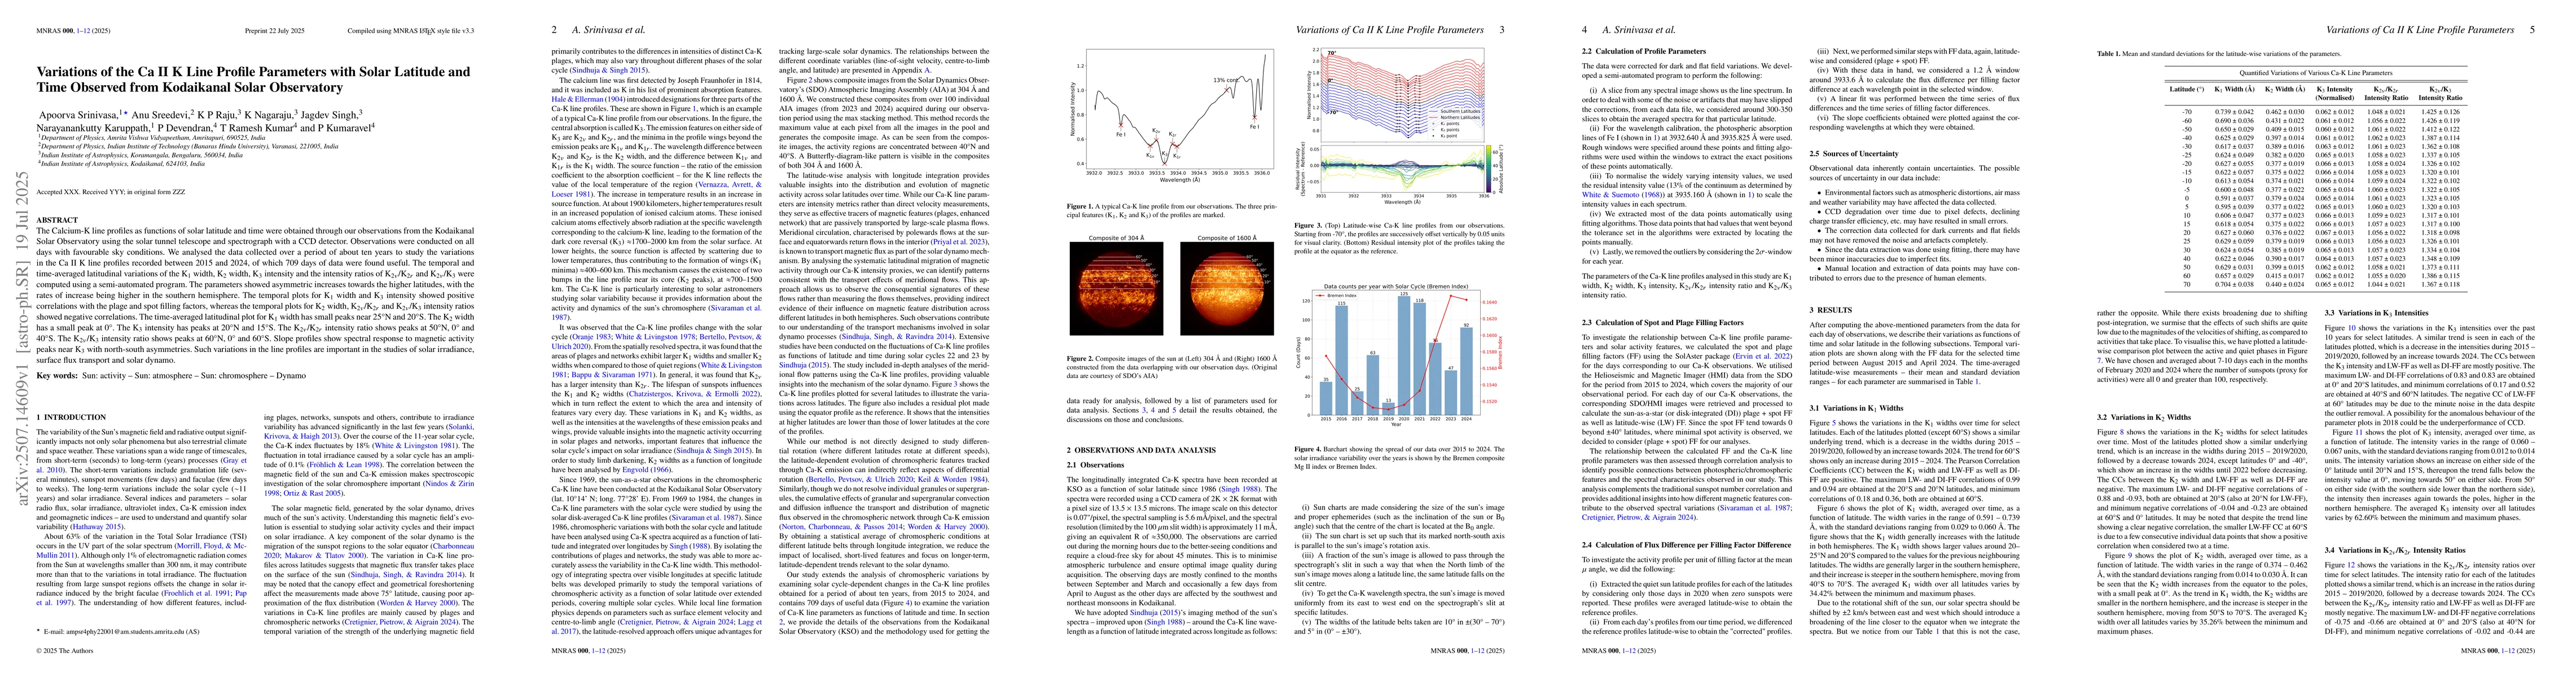
The Calcium-K line profiles as functions of solar latitude and time were obtained through our observations from the Kodaikanal Solar Observatory using the solar tunnel telescope and spectrograph with a CCD detector. Observations were conducted on all days with favourable sky conditions. We analysed the data collected over a period of about ten years to study the variations in the Ca II K line profiles recorded between 2015 and 2024, of which 709 days of data were found useful. The temporal and time-averaged latitudinal variations of the K$_{1}$ width, K$_{2}$ width, K$_{3}$ intensity and the intensity ratios of K$_{2v}$/K$_{2r}$ and K$_{2v}$/K$_{3}$ were computed using a semi-automated program. The parameters showed asymmetric increases towards the higher latitudes, with the rates of increase being higher in the southern hemisphere. The temporal plots for K$_{1}$ width and K$_{3}$ intensity showed positive correlations with the plage and spot filling factors, whereas the temporal plots for K$_{2}$ width, K$_{2v}$/K$_{2r}$ and K$_{2v}$/K$_{3}$ intensity ratios showed negative correlations. The time-averaged latitudinal plot for K$_{1}$ width has small peaks near 25{\deg}N and 20{\deg}S. The K$_{2}$ width has a small peak at 0{\deg}. The K$_{3}$ intensity has peaks at 20{\deg}N and 15{\deg}S. The K$_{2v}$/K$_{2r}$ intensity ratio shows peaks at 50$\degree$N, 0{\deg} and 40{\deg}S. The K$_{2v}$/K$_{3}$ intensity ratio shows peaks at 60{\deg}N, 0{\deg} and 60{\deg}S. Slope profiles show spectral response to magnetic activity peaks near K$_{3}$ with north-south asymmetries. Such variations in the line profiles are important in the studies of solar irradiance, surface flux transport and solar dynamo.
AI Key Findings
Get AI-generated insights about this paper's methodology, results, and significance.
Paper Details
PDF Preview
Similar Papers
Found 4 papersDifferential Rotation of the Solar Chromosphere: A Century-long Perspective from Kodaikanal Solar Observatory Ca II K Data
Dipankar Banerjee, Judhajeet Basu, Bibhuti Kumar Jha et al.
No citations found for this paper.
Comments (0)