Publication
Metrics
AI Quick Summary
This paper uses the variogram to detect deviations from statistical isotropy in Cosmic Microwave Background temperature fluctuations, revealing significant differences between the northern and southern hemispheres in the WMAP data. The northern hemisphere's variogram shows lower sill and range values, suggesting potential anisotropy that could necessitate revisions in early universe physics models.
Paper Preview
Abstract
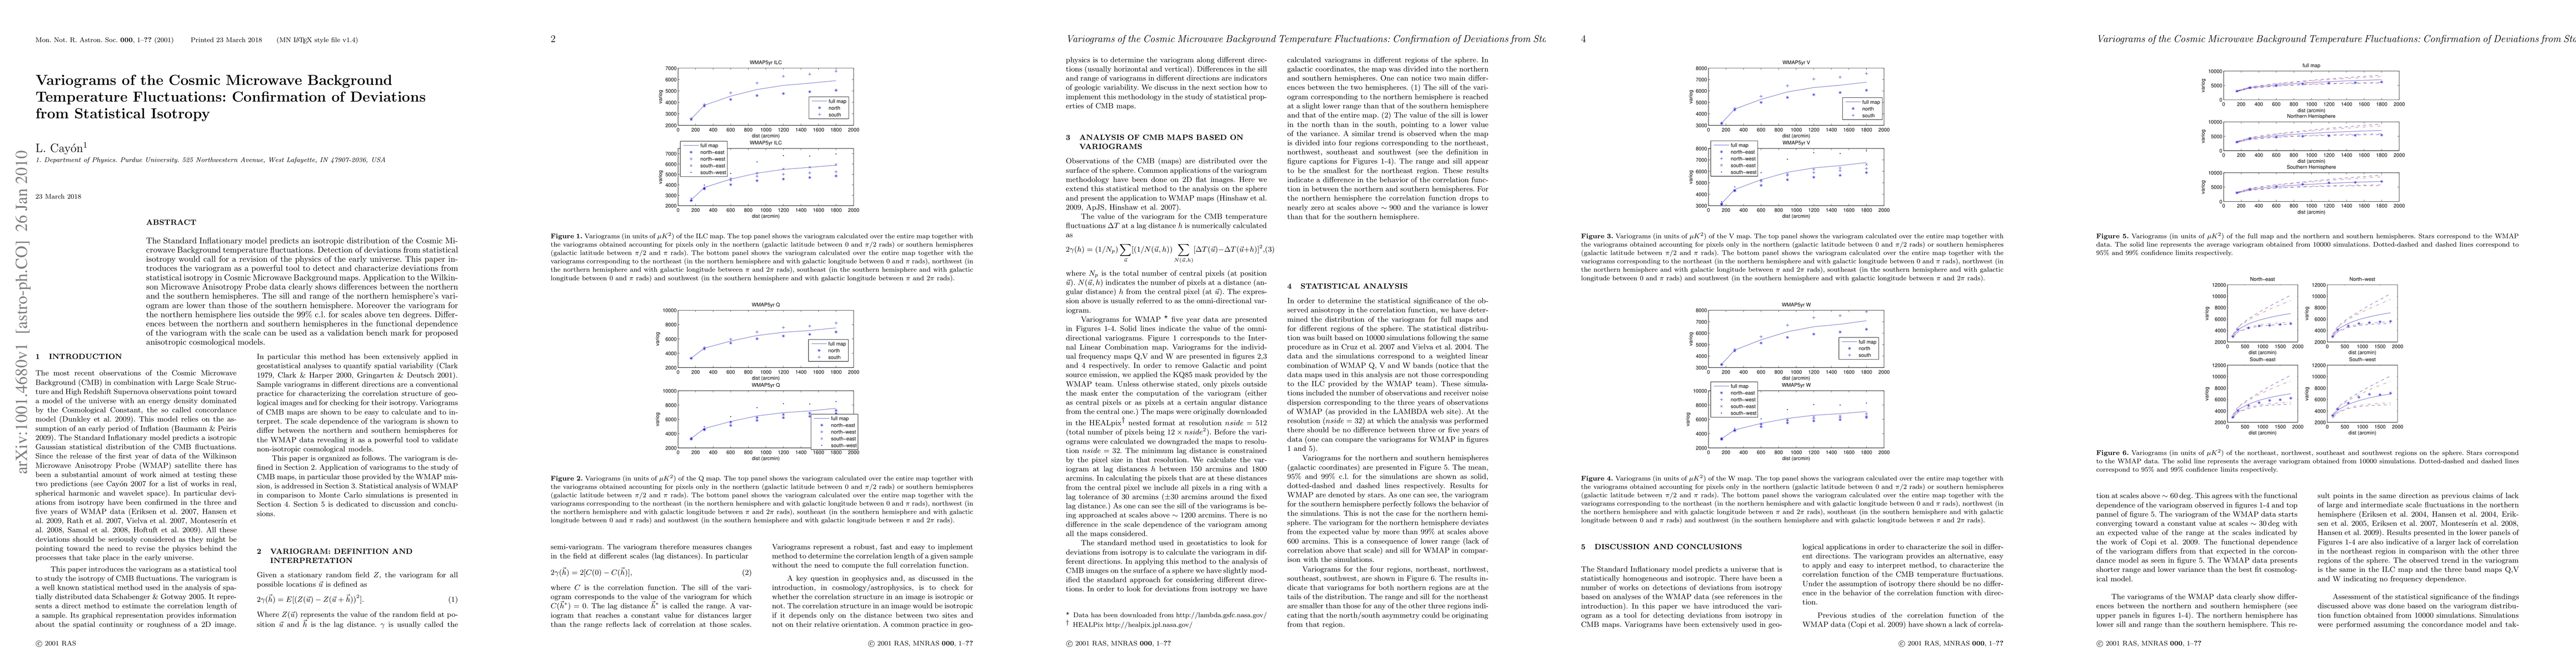
The Standard Inflationary model predicts an isotropic distribution of the Cosmic Microwave Background temperature fluctuations. Detection of deviations from statistical isotropy would call for a revision of the physics of the early universe. This paper introduces the variogram as a powerful tool to detect and characterize deviations from statistical isotropy in Cosmic Microwave Background maps. Application to the Wilkinson Microwave Anisotropy Probe data clearly shows differences between the northern and the southern hemispheres. The sill and range of the northern hemisphere's variogram are lower than those of the southern hemisphere. Moreover the variogram for the northern hemisphere lies outside the 99% c.l. for scales above ten degrees. Differences between the northern and southern hemispheres in the functional dependence of the variogram with the scale can be used as a validation bench mark for proposed anisotropic cosmological models.
AI Key Findings
Get AI-generated insights about this paper's methodology, results, significance, and more — seven facets brought into focus.
Impact
Paper Details
PDF Preview
Key Terms
Citation Network
Current paper (gray), citations (green), references (blue)
Display is limited for performance on very large graphs.
Discussion 0