VARTS: A Tool for the Visualization and Analysis of Representative Time Series Data
Publication
Metrics
Paper Preview
Abstract
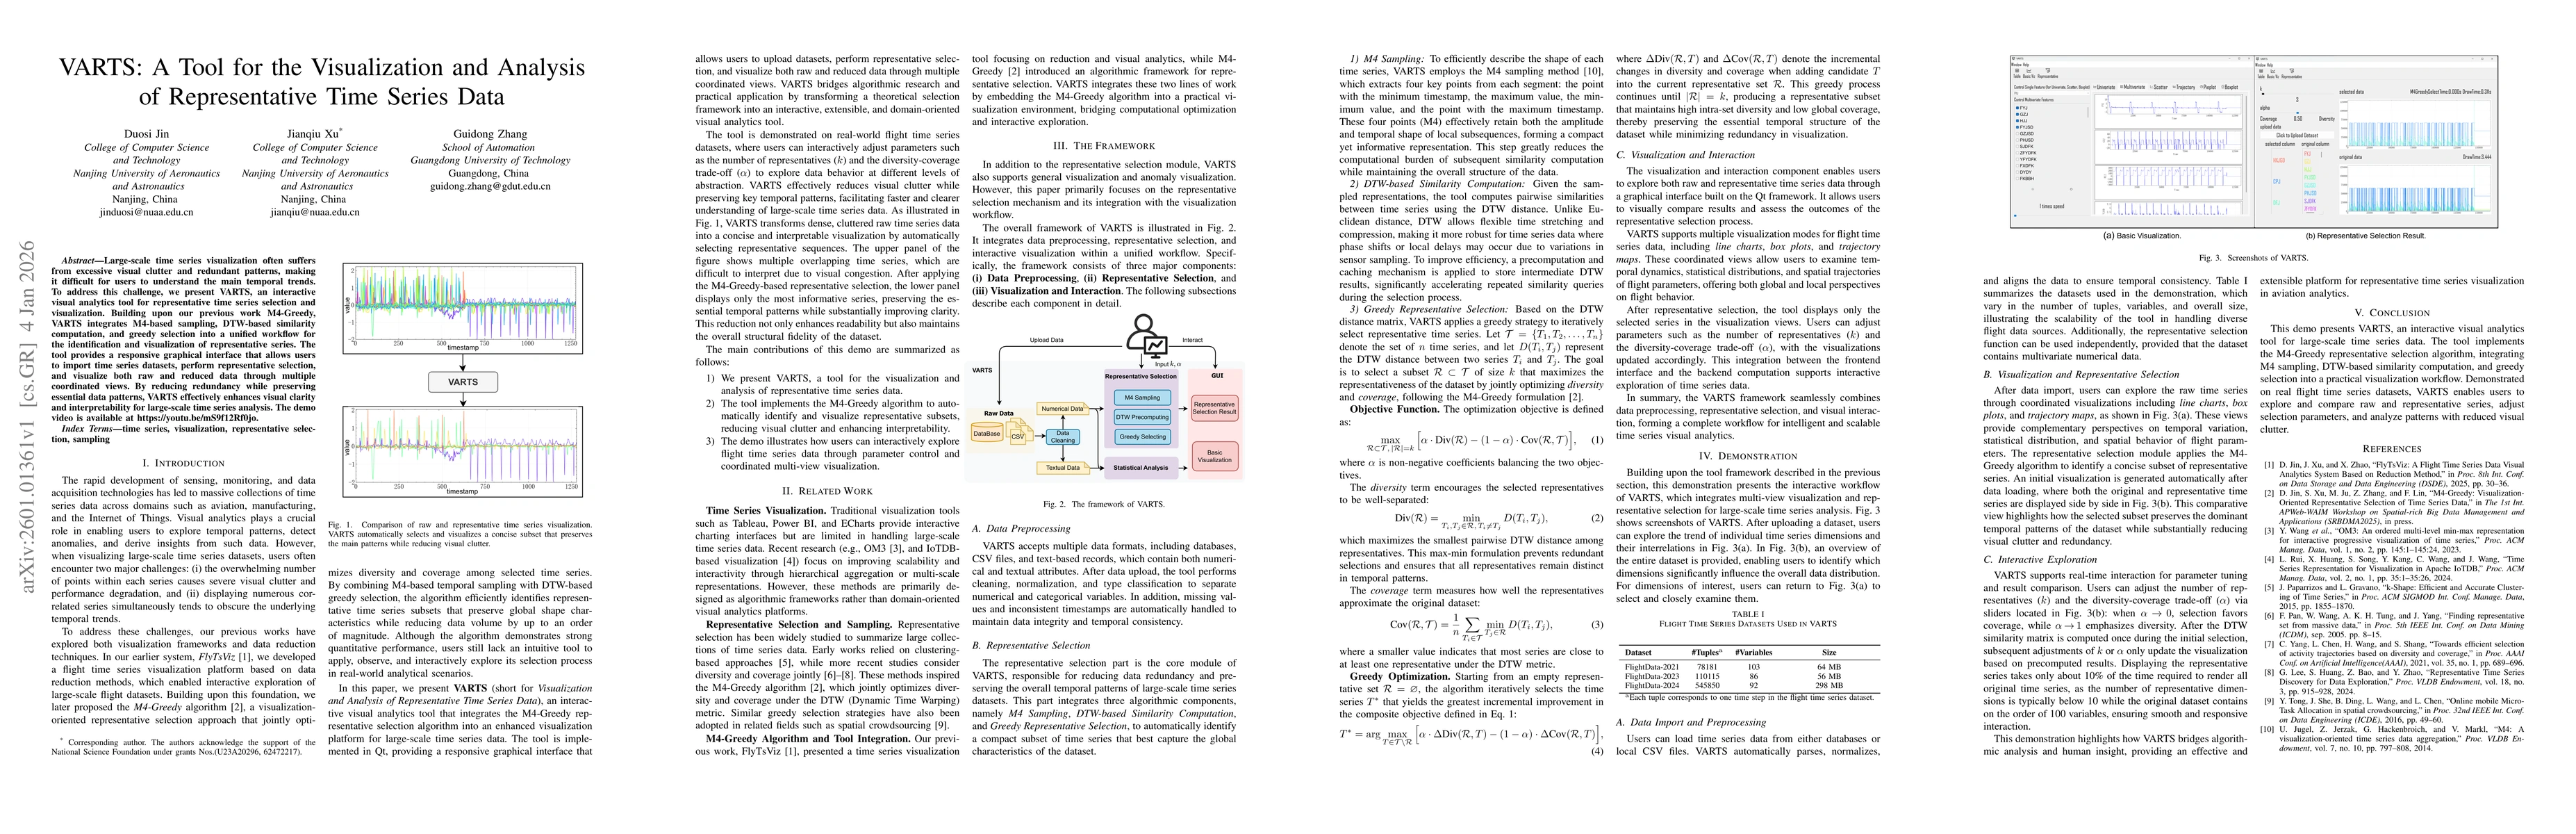
Large-scale time series visualization often suffers from excessive visual clutter and redundant patterns, making it difficult for users to understand the main temporal trends. To address this challenge, we present VARTS, an interactive visual analytics tool for representative time series selection and visualization. Building upon our previous work M4-Greedy, VARTS integrates M4-based sampling, DTW-based similarity computation, and greedy selection into a unified workflow for the identification and visualization of representative series. The tool provides a responsive graphical interface that allows users to import time series datasets, perform representative selection, and visualize both raw and reduced data through multiple coordinated views. By reducing redundancy while preserving essential data patterns, VARTS effectively enhances visual clarity and interpretability for large-scale time series analysis. The demo video is available at https://youtu.be/mS9f12Rf0jo.
AI Key Findings
Get AI-generated insights about this paper's methodology, results, significance, and more — seven facets brought into focus.
Discussion 0