Summary
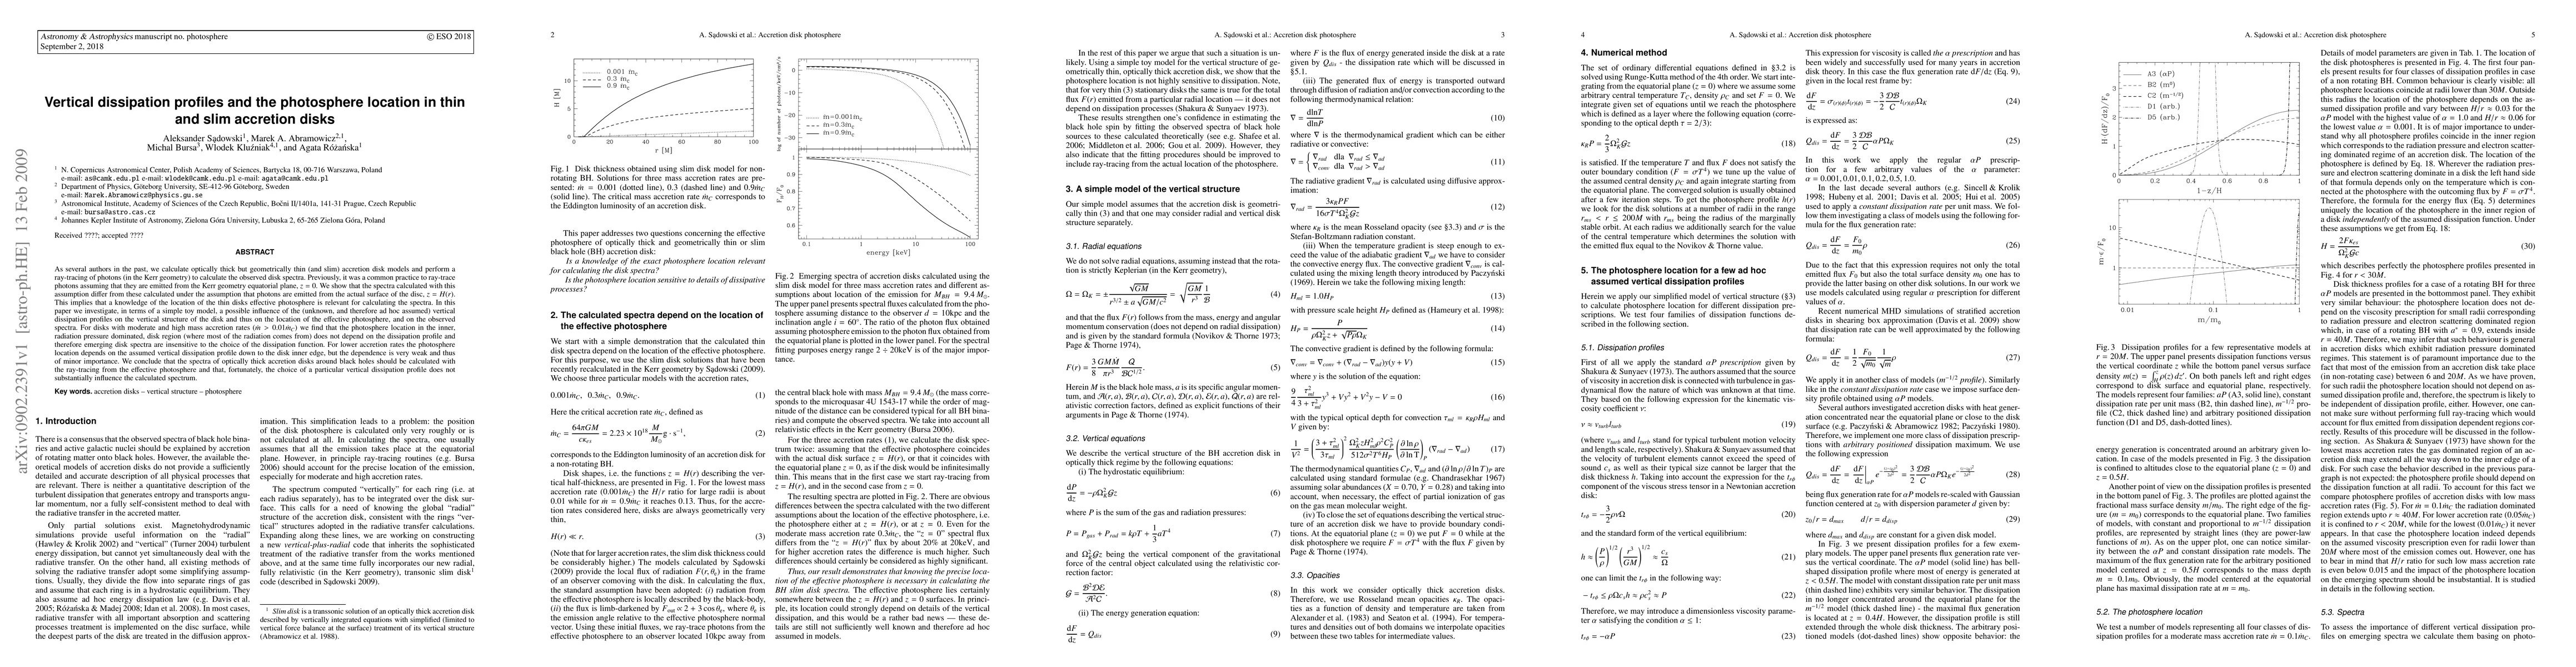
We calculate optically thick but geometrically thin (and slim) accretion disk models and perform a ray-tracing of photons (in the Kerr geometry) to calculate the observed disk spectra. Previously, it was a common practice to ray-trace photons assuming that they are emitted from the Kerr geometry equatorial plane, z = 0. We show that the spectra calculated with this assumption differ from these calculated under the assumption that photons are emitted from the actual surface of the disc, z = H(r). This implies that a knowledge of the location of the thin disks effective photosphere is relevant for calculating the spectra. In this paper we investigate, in terms of a simple toy model, a possible influence of the (unknown, and therefore ad hoc assumed) vertical dissipation profiles on the vertical structure of the disk and thus on the location of the effective photosphere, and on the observed spectra. For disks with moderate and high mass accretion rates (\dot m>0.01\dot m_C) we find that the photosphere location in the inner, radiation pressure dominated, disk region (where most of the radiation comes from) does not depend on the dissipation profile and therefore emerging disk spectra are insensitive to the choice of the dissipation function. For lower accretion rates the photosphere location depends on the assumed vertical dissipation profile down to the disk inner edge, but the dependence is very weak and thus of minor importance. We conclude that the spectra of optically thick accretion disks around black holes should be calculated with the ray-tracing from the effective photosphere and that, fortunately, the choice of a particular vertical dissipation profile does not substantially influence the calculated spectrum.
AI Key Findings
Get AI-generated insights about this paper's methodology, results, and significance.
Paper Details
PDF Preview
Key Terms
Citation Network
Current paper (gray), citations (green), references (blue)
Display is limited for performance on very large graphs.
Similar Papers
Found 4 papers| Title | Authors | Year | Actions |
|---|
Comments (0)