Authors
Summary
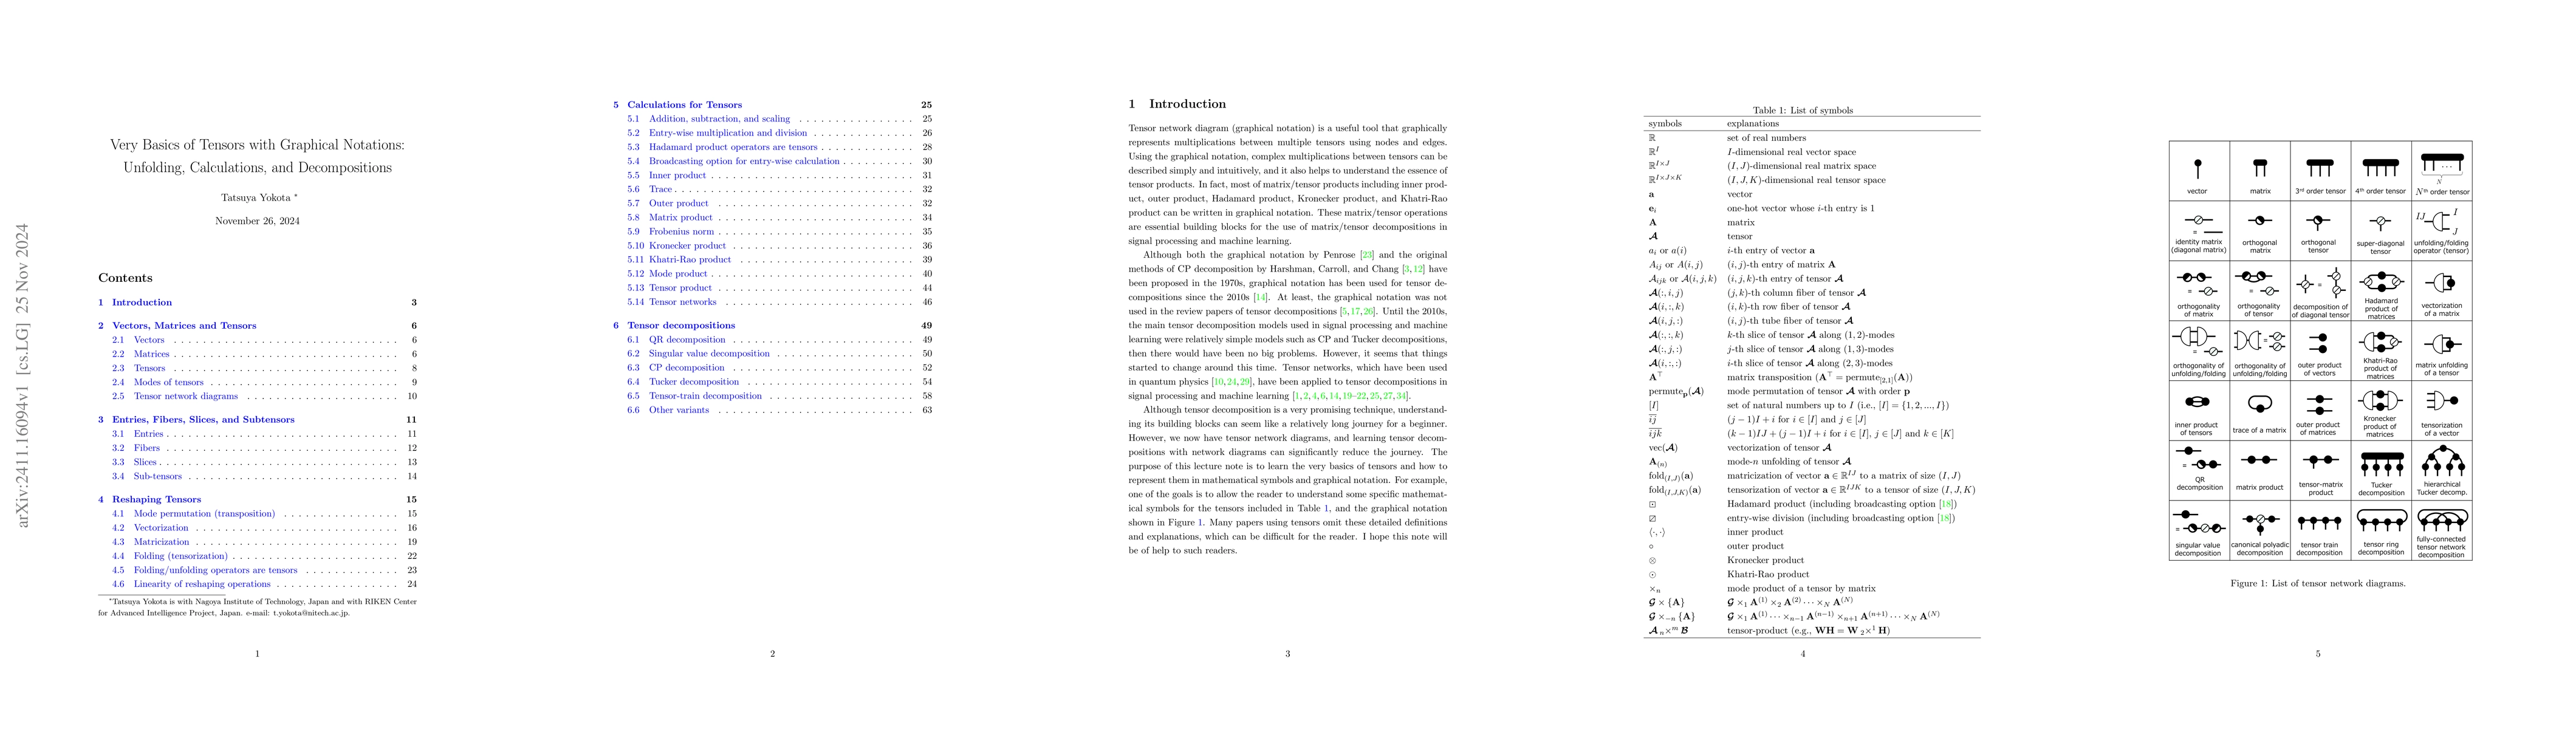
Tensor network diagram (graphical notation) is a useful tool that graphically represents multiplications between multiple tensors using nodes and edges. Using the graphical notation, complex multiplications between tensors can be described simply and intuitively, and it also helps to understand the essence of tensor products. In fact, most of matrix/tensor products including inner product, outer product, Hadamard product, Kronecker product, and Khatri-Rao product can be written in graphical notation. These matrix/tensor operations are essential building blocks for the use of matrix/tensor decompositions in signal processing and machine learning. The purpose of this lecture note is to learn the very basics of tensors and how to represent them in mathematical symbols and graphical notation. Many papers using tensors omit these detailed definitions and explanations, which can be difficult for the reader. I hope this note will be of help to such readers.
AI Key Findings
Get AI-generated insights about this paper's methodology, results, and significance.
Paper Details
PDF Preview
Similar Papers
Found 4 papersEquivalent Polyadic Decompositions of Matrix Multiplication Tensors
Raphaël M. Jungers, P. -A. Absil, Marc Van Barel et al.
No citations found for this paper.
Comments (0)