VGBench: Evaluating Large Language Models on Vector Graphics Understanding and Generation
Publication
Metrics
AI Quick Summary
VGBench is a comprehensive benchmark to evaluate Large Language Models (LLMs) on vector graphics, assessing both understanding and generation across various formats and question types. Findings reveal strong LLM performance but challenges with low-level formats like SVG.
Paper Preview
Abstract
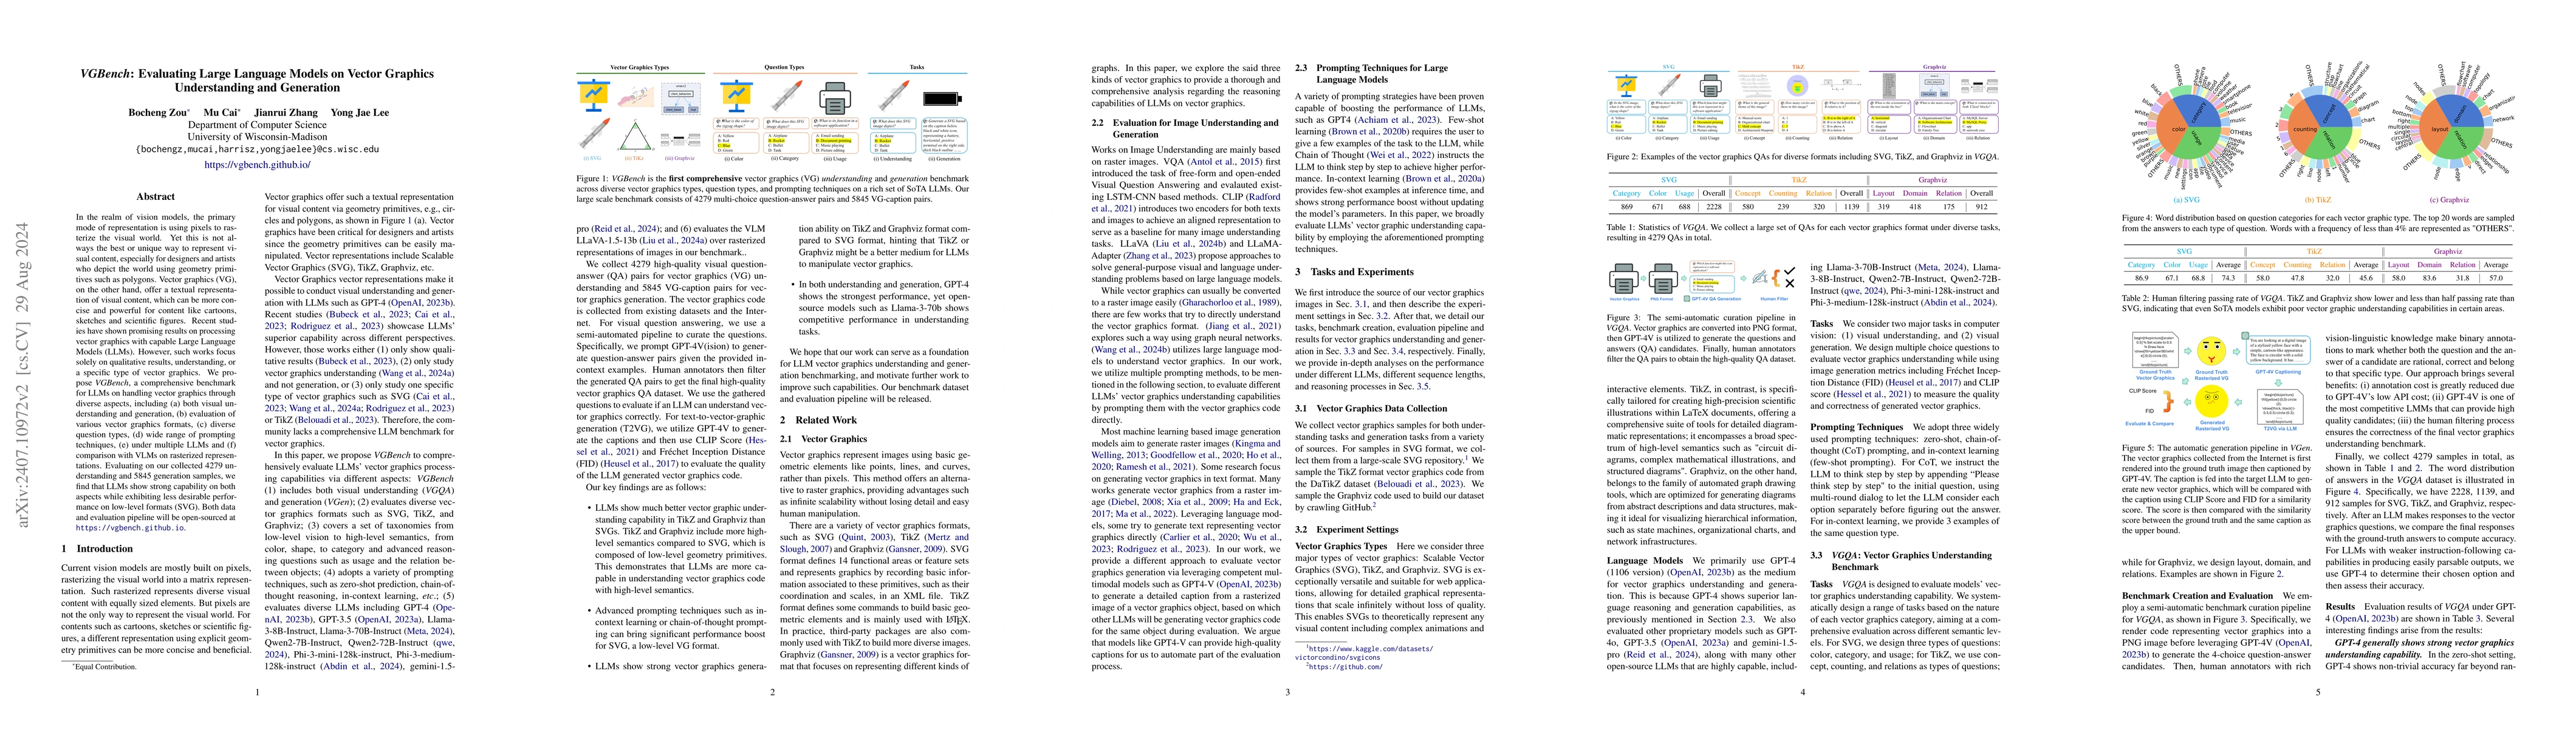
In the realm of vision models, the primary mode of representation is using pixels to rasterize the visual world. Yet this is not always the best or unique way to represent visual content, especially for designers and artists who depict the world using geometry primitives such as polygons. Vector graphics (VG), on the other hand, offer a textual representation of visual content, which can be more concise and powerful for content like cartoons or sketches. Recent studies have shown promising results on processing vector graphics with capable Large Language Models (LLMs). However, such works focus solely on qualitative results, understanding, or a specific type of vector graphics. We propose VGBench, a comprehensive benchmark for LLMs on handling vector graphics through diverse aspects, including (a) both visual understanding and generation, (b) evaluation of various vector graphics formats, (c) diverse question types, (d) wide range of prompting techniques, (e) under multiple LLMs. Evaluating on our collected 4279 understanding and 5845 generation samples, we find that LLMs show strong capability on both aspects while exhibiting less desirable performance on low-level formats (SVG). Both data and evaluation pipeline will be open-sourced at https://vgbench.github.io.
AI Key Findings
Get AI-generated insights about this paper's methodology, results, significance, and more — seven facets brought into focus.
Impact
Authors
PDF Preview
Key Terms
Citation Network
Current paper (gray), citations (green), references (blue)
Display is limited for performance on very large graphs.
Discussion 0