Publication
Metrics
AI Quick Summary
Researchers study persistence diagrams built from Vietoris-Rips complexes to understand their distribution of connected components and behavior with noise. Their findings help inform statistical inference and replication of the diagrams.
Paper Preview
Abstract
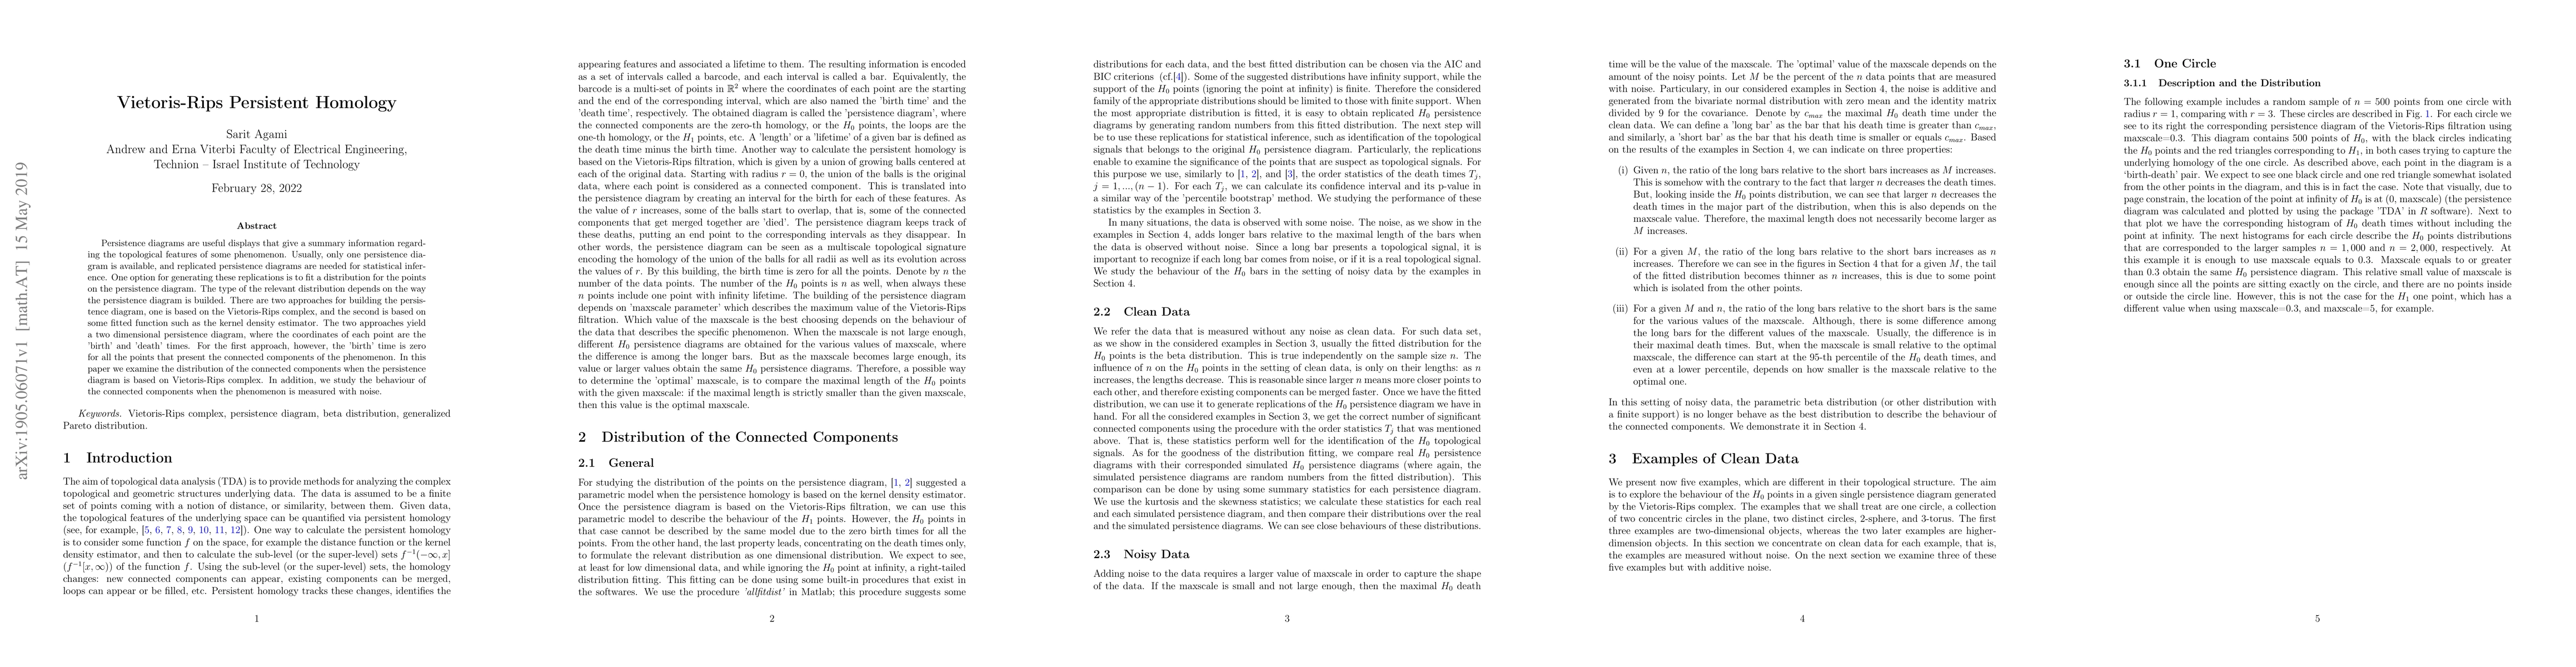
Persistence diagrams are useful displays that give a summary information regarding the topological features of some phenomenon. Usually, only one persistence diagram is available, and replicated persistence diagrams are needed for statistical inference. One option for generating these replications is to fit a distribution for the points on the persistence diagram. The type of the relevant distribution depends on the way the persistence diagram is builded. There are two approaches for building the persistence diagram, one is based on the Vietoris-Rips complex, and the second is based on some fitted function such as the kernel density estimator. The two approaches yield a two dimensional persistence diagram, where the coordinates of each point are the 'birth' and 'death' times. For the first approach, however, the 'birth' time is zero for all the points that present the connected components of the phenomenon. In this paper we examine the distribution of the connected components when the persistence diagram is based on Vietoris-Rips complex. In addition, we study the behaviour of the connected components when the phenomenon is measured with noise.
AI Key Findings
Get AI-generated insights about this paper's methodology, results, significance, and more — seven facets brought into focus.
Impact
Paper Details
PDF Preview
Key Terms
Citation Network
Current paper (gray), citations (green), references (blue)
Display is limited for performance on very large graphs.
Discussion 0