Viewing Simpson's Paradox
Publication
Metrics
AI Quick Summary
This paper explains Simpson's Paradox in simple terms using algebra and geometry, clarifying the conditions under which it occurs and emphasizing its practical identification by domain experts. It also discusses the paradox in predictive contexts, highlighting the role of causal reasoning in its resolution.
Paper Preview
Abstract
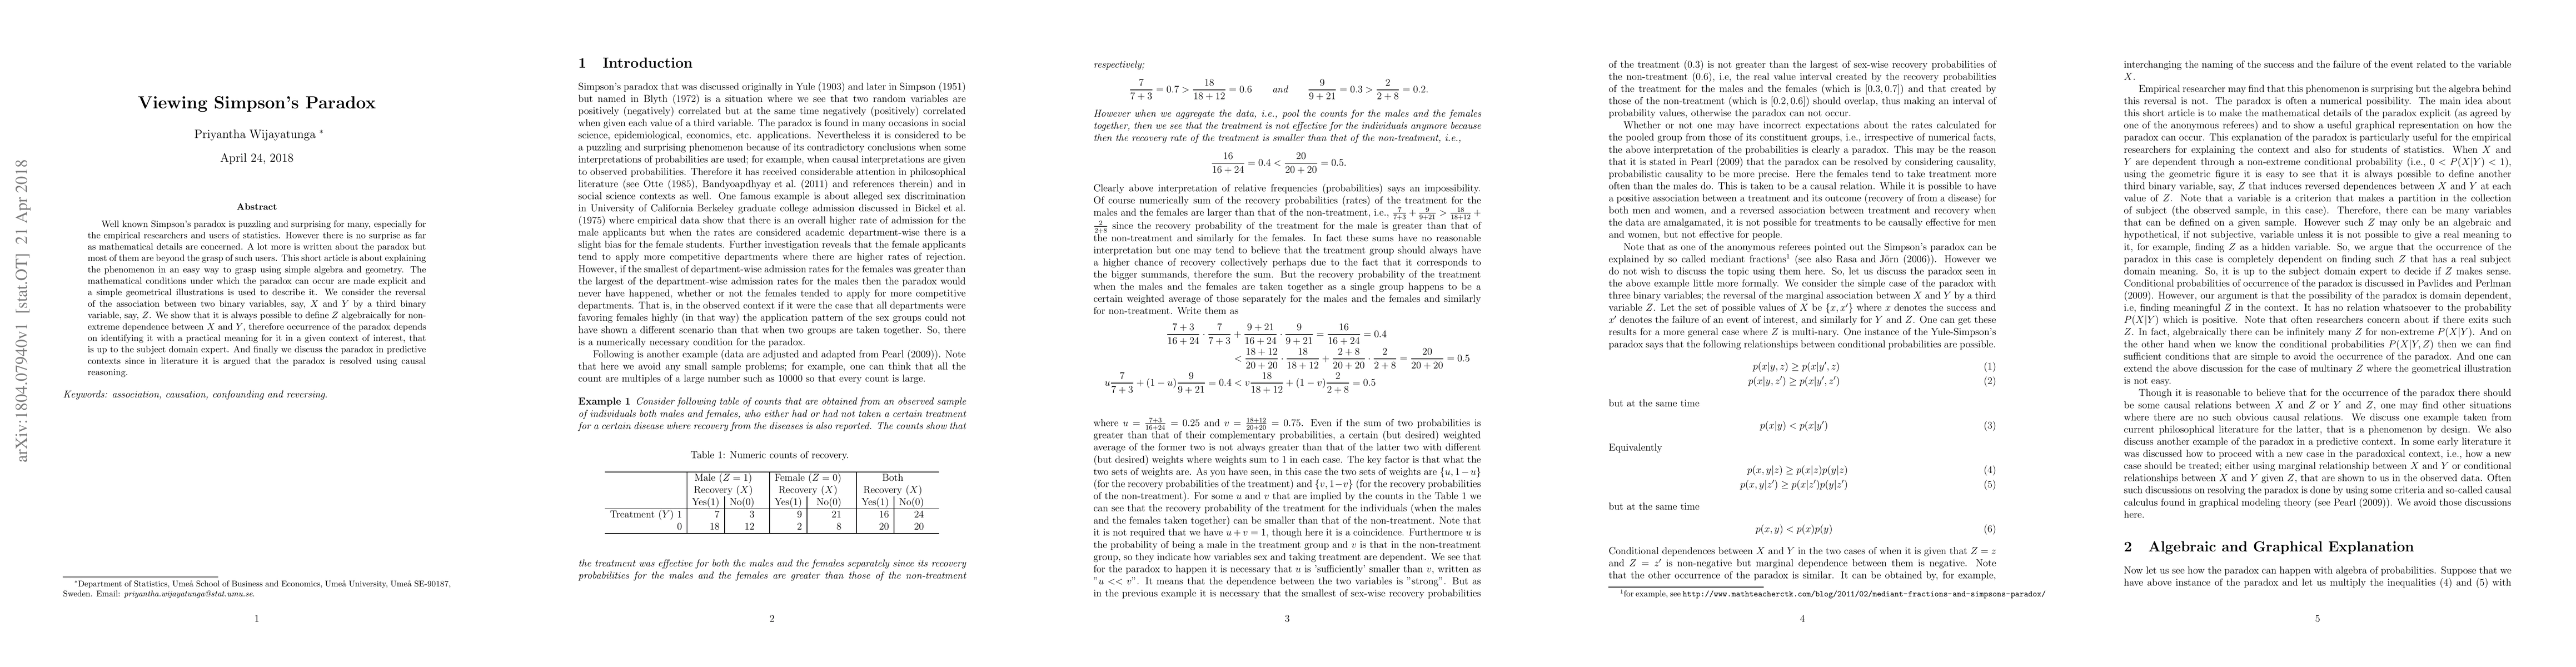
Well known Simpson's paradox is puzzling and surprising for many, especially for the empirical researchers and users of statistics. However there is no surprise as far as mathematical details are concerned. A lot more is written about the paradox but most of them are beyond the grasp of such users. This short article is about explaining the phenomenon in an easy way to grasp using simple algebra and geometry. The mathematical conditions under which the paradox can occur are made explicit and a simple geometrical illustrations is used to describe it. We consider the reversal of the association between two binary variables, say, $X$ and $Y$ by a third binary variable, say, $Z$. We show that it is always possible to define $Z$ algebraically for non-extreme dependence between $X$ and $Y$, therefore occurrence of the paradox depends on identifying it with a practical meaning for it in a given context of interest, that is up to the subject domain expert. And finally we discuss the paradox in predictive contexts since in literature it is argued that the paradox is resolved using causal reasoning.
AI Key Findings
Get AI-generated insights about this paper's methodology, results, significance, and more — seven facets brought into focus.
Impact
Paper Details
PDF Preview
Key Terms
Citation Network
Current paper (gray), citations (green), references (blue)
Display is limited for performance on very large graphs.
Discussion 0