Publication
Metrics
Paper Preview
Abstract
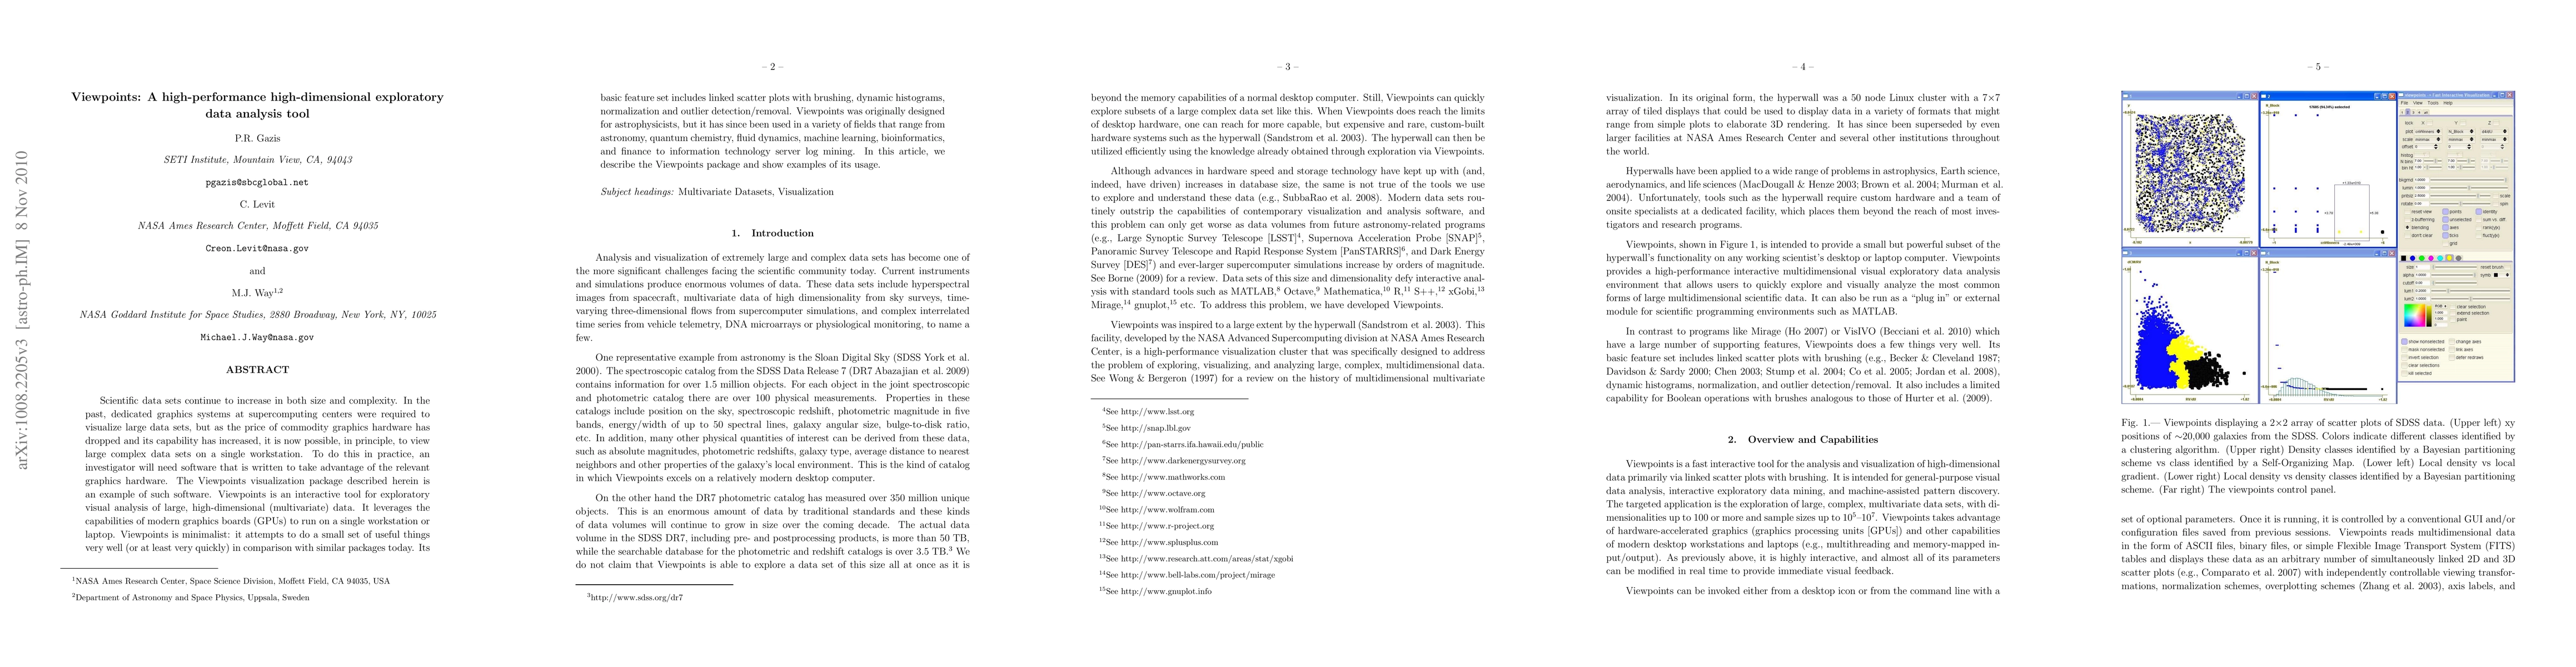
Scientific data sets continue to increase in both size and complexity. In the past, dedicated graphics systems at supercomputing centers were required to visualize large data sets, but as the price of commodity graphics hardware has dropped and its capability has increased, it is now possible, in principle, to view large complex data sets on a single workstation. To do this in practice, an investigator will need software that is written to take advantage of the relevant graphics hardware. The Viewpoints visualization package described herein is an example of such software. Viewpoints is an interactive tool for exploratory visual analysis of large, high-dimensional (multivariate) data. It leverages the capabilities of modern graphics boards (GPUs) to run on a single workstation or laptop. Viewpoints is minimalist: it attempts to do a small set of useful things very well (or at least very quickly) in comparison with similar packages today. Its basic feature set includes linked scatter plots with brushing, dynamic histograms, normalization and outlier detection/removal. Viewpoints was originally designed for astrophysicists, but it has since been used in a variety of fields that range from astronomy, quantum chemistry, fluid dynamics, machine learning, bioinformatics, and finance to information technology server log mining. In this article, we describe the Viewpoints package and show examples of its usage.
AI Key Findings
Get AI-generated insights about this paper's methodology, results, significance, and more — seven facets brought into focus.
Impact
Paper Details
PDF Preview
Key Terms
Citation Network
Current paper (gray), citations (green), references (blue)
Display is limited for performance on very large graphs.
Discussion 0