Publication
Metrics
AI Quick Summary
This paper explores how coronavirus skeptics use orthodox data practices to promote unorthodox science online, revealing an epistemological gap that causes pro- and anti-mask groups to draw vastly different conclusions from similar data. The study combines quantitative analysis of Twitter visualizations and ethnographic analysis of Facebook conversations to highlight the sociopolitical rift regarding science's role in public life.
Paper Preview
Abstract
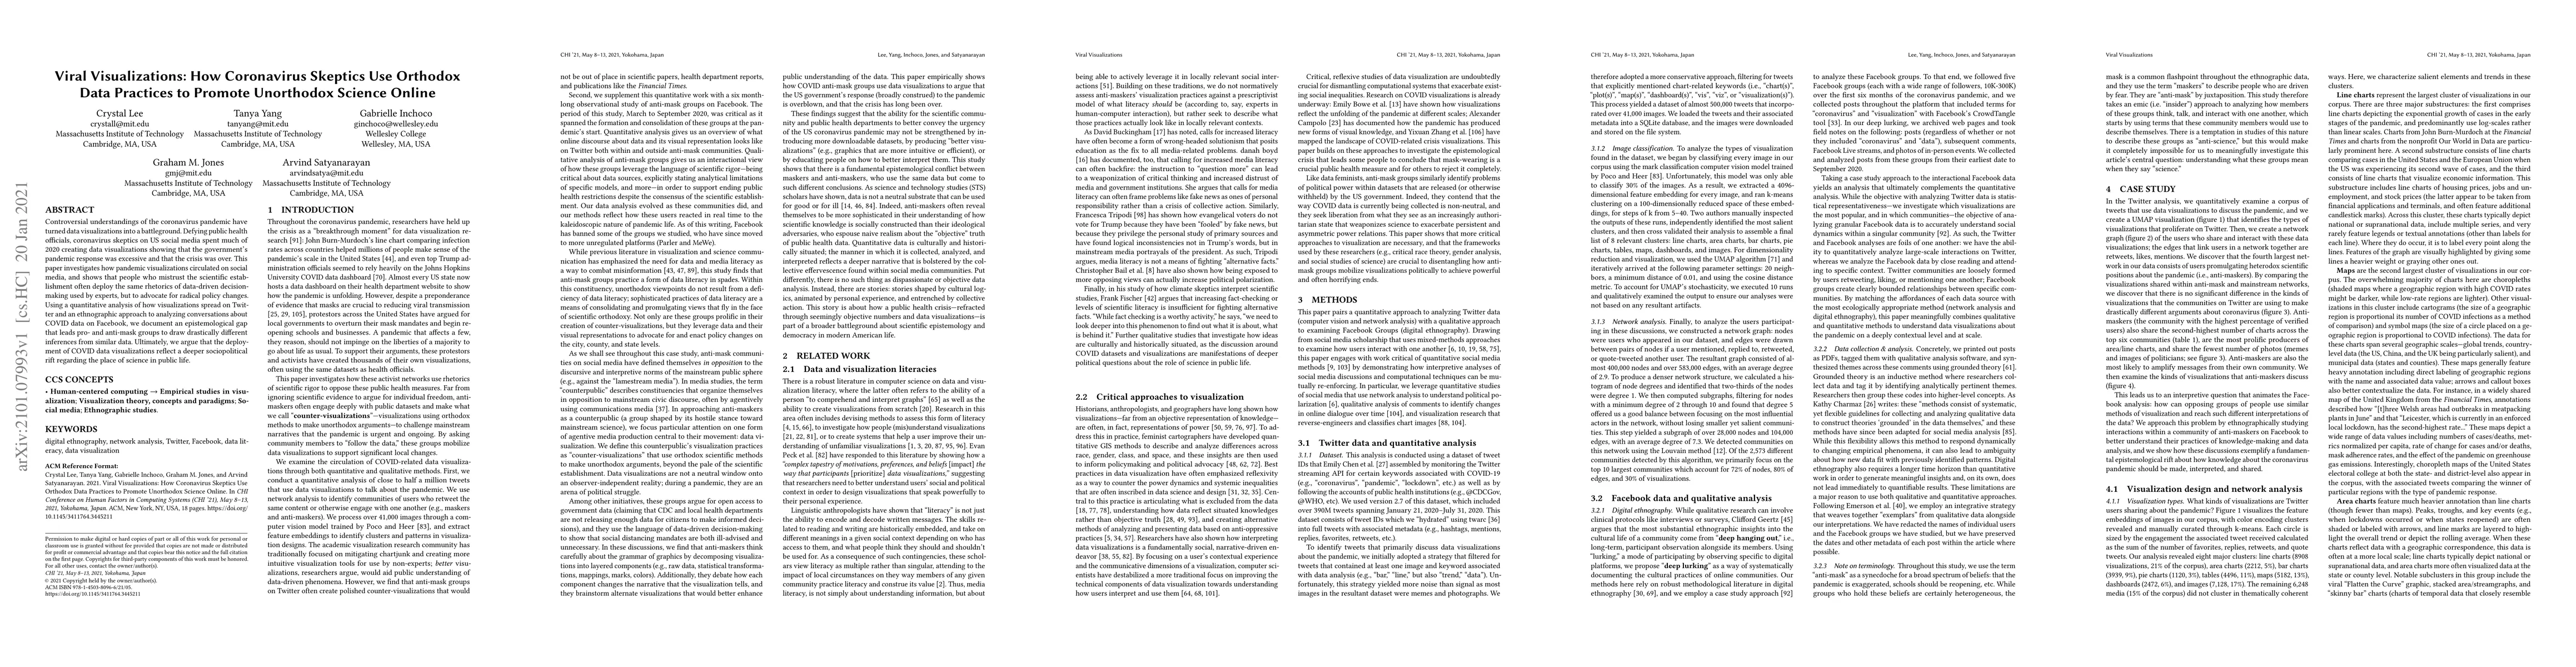
Controversial understandings of the coronavirus pandemic have turned data visualizations into a battleground. Defying public health officials, coronavirus skeptics on US social media spent much of 2020 creating data visualizations showing that the government's pandemic response was excessive and that the crisis was over. This paper investigates how pandemic visualizations circulated on social media, and shows that people who mistrust the scientific establishment often deploy the same rhetorics of data-driven decision-making used by experts, but to advocate for radical policy changes. Using a quantitative analysis of how visualizations spread on Twitter and an ethnographic approach to analyzing conversations about COVID data on Facebook, we document an epistemological gap that leads pro- and anti-mask groups to draw drastically different inferences from similar data. Ultimately, we argue that the deployment of COVID data visualizations reflect a deeper sociopolitical rift regarding the place of science in public life.
AI Key Findings
Get AI-generated insights about this paper's methodology, results, significance, and more — seven facets brought into focus.
Impact
Paper Details
Authors
PDF Preview
Key Terms
Citation Network
Current paper (gray), citations (green), references (blue)
Display is limited for performance on very large graphs.
Discussion 0