Publication
Metrics
AI Quick Summary
This paper extends the analysis of virus dynamics on hub-and-spoke graphs to $k$-level starlike structures, where $k \geq 3$. The authors determine critical thresholds for virus propagation under the SIS model, showing that the dynamics of higher-level starlike graphs can be reduced to a three-level analysis.
Paper Preview
Abstract
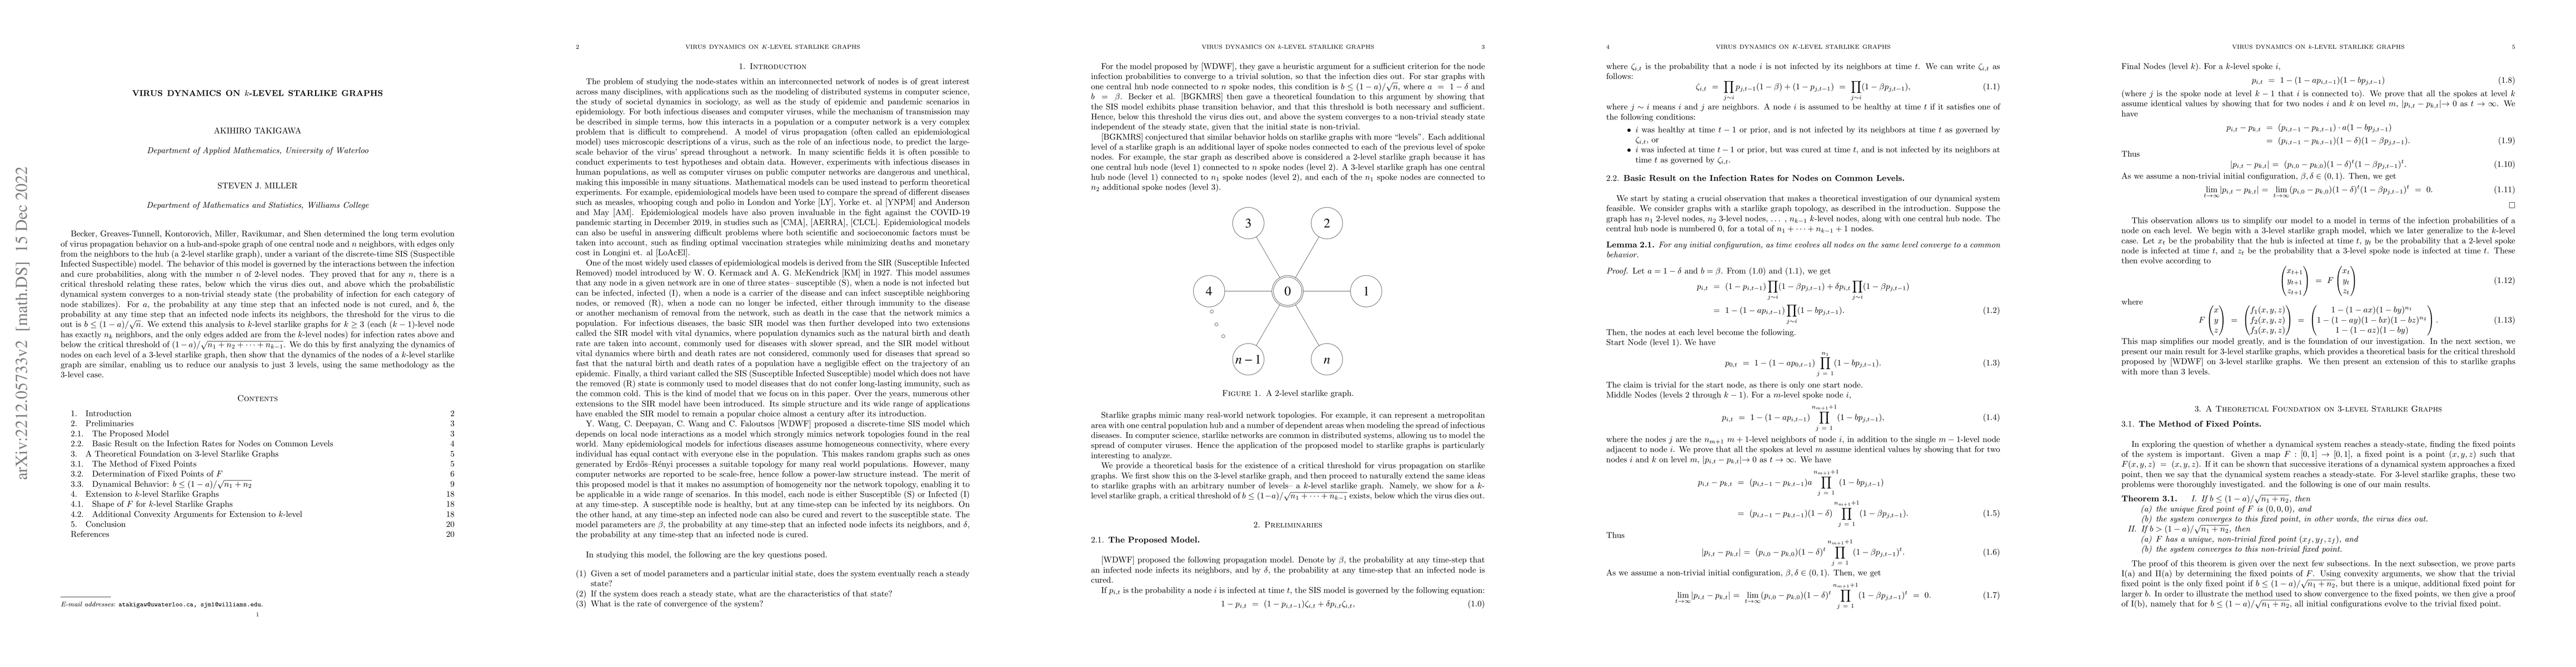
Becker, Greaves-Tunnell, Kontorovich, Miller, Ravikumar, and Shen determined the long term evolution of virus propagation behavior on a hub-and-spoke graph of one central node and $n$ neighbors, with edges only from the neighbors to the hub (a $2$-level starlike graph), under a variant of the discrete-time SIS (Suspectible Infected Suspectible) model. The behavior of this model is governed by the interactions between the infection and cure probabilities, along with the number $n$ of $2$-level nodes. They proved that for any $n$, there is a critical threshold relating these rates, below which the virus dies out, and above which the probabilistic dynamical system converges to a non-trivial steady state (the probability of infection for each category of node stabilizes). For $a$, the probability at any time step that an infected node is not cured, and $b$, the probability at any time step that an infected node infects its neighbors, the threshold for the virus to die out is $b \leq (1-a)/\sqrt{n}$. We extend this analysis to $k$-level starlike graphs for $k \geq 3$ (each $(k-1)$-level node has exactly $n_k$ neighbors, and the only edges added are from the $k$-level nodes) for infection rates above and below the critical threshold of $(1-a)/\sqrt{n_1+n_2+\dots+n_{k-1}}$. We do this by first analyzing the dynamics of nodes on each level of a $3$-level starlike graph, then show that the dynamics of the nodes of a $k$-level starlike graph are similar, enabling us to reduce our analysis to just $3$ levels, using the same methodology as the $3$-level case.
AI Key Findings
Get AI-generated insights about this paper's methodology, results, significance, and more — seven facets brought into focus.
Impact
Paper Details
Authors
PDF Preview
Key Terms
Citation Network
Current paper (gray), citations (green), references (blue)
Display is limited for performance on very large graphs.
Discussion 0