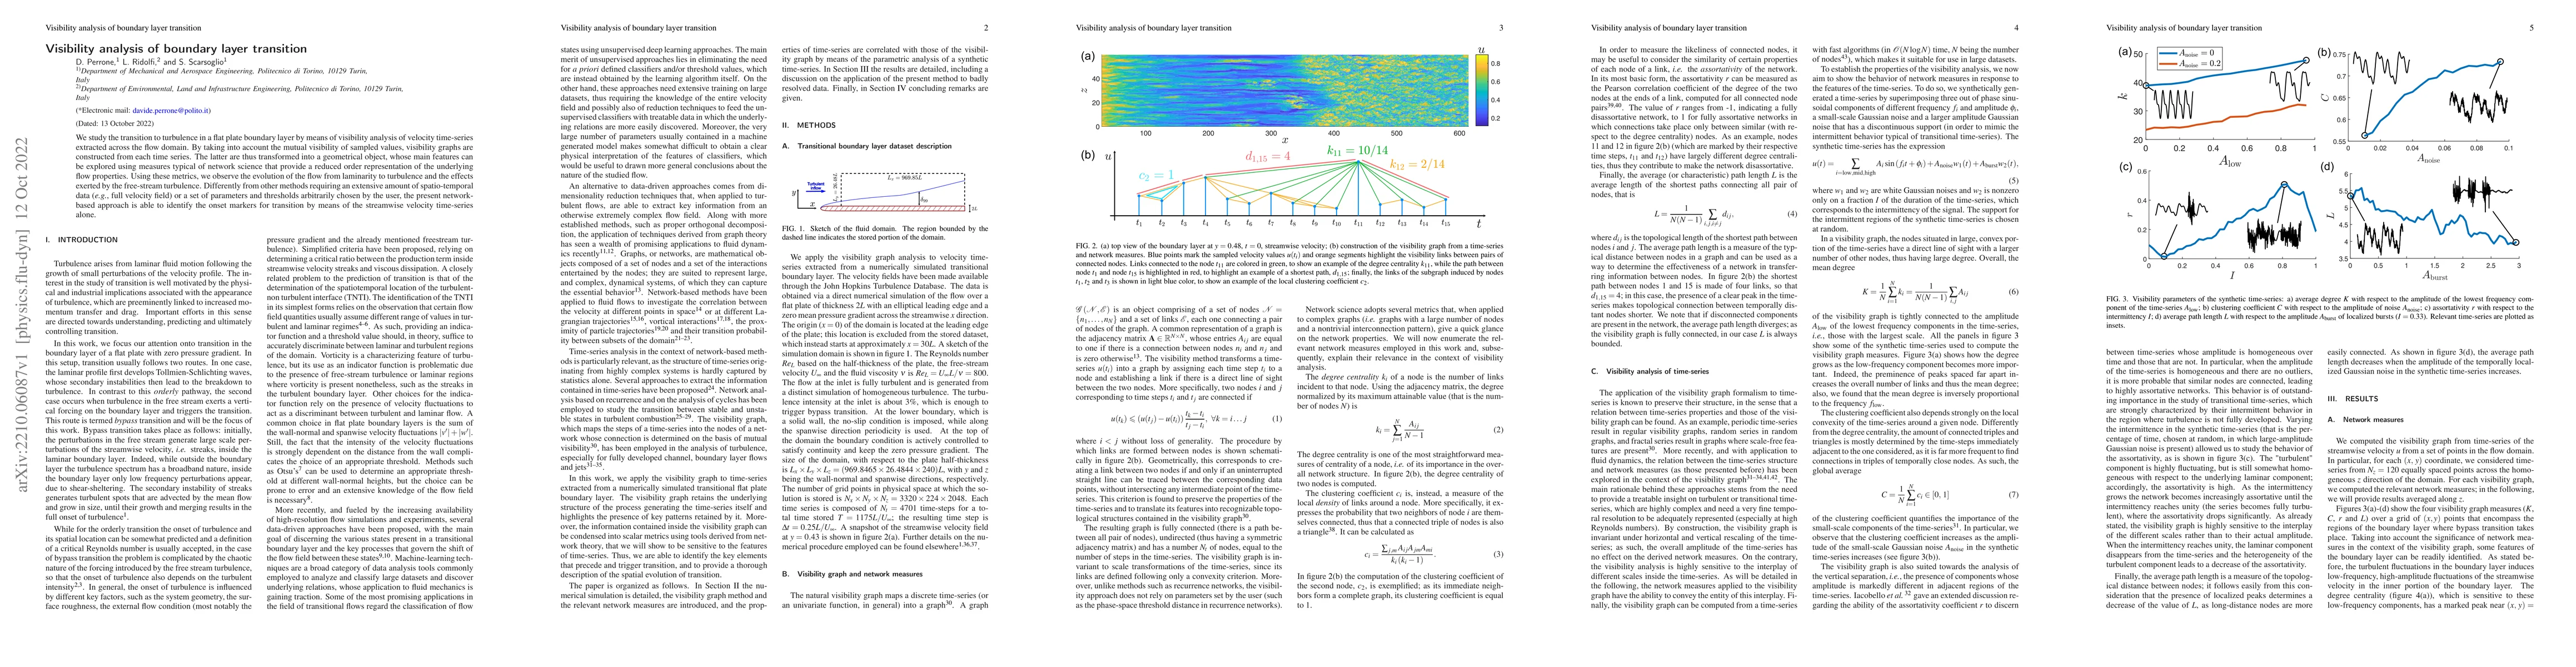
Visibility analysis of boundary layer transition

Source: ArXiv

AI Quick Summary

This paper employs visibility analysis to study the transition to turbulence in a flat plate boundary layer, transforming velocity time-series into visibility graphs. These graphs, analyzed using network science metrics, reveal the transition process and effects of free-stream turbulence without requiring extensive spatiotemporal data or arbitrary parameters.

Share: Share on X LinkedIn

Summary

We study the transition to turbulence in a flat plate boundary layer by means of visibility analysis of velocity time-series extracted across the flow domain. By taking into account the mutual visibility of sampled values, visibility graphs are constructed from each time series. The latter are, thus, transformed into a geometrical object, whose main features can be explored using measures typical of network science that provide a reduced order representation of the underlying flow properties. Using these metrics, we observe the evolution of the flow from laminarity to turbulence and the effects exerted by the free-stream turbulence. Different from other methods requiring an extensive amount of spatiotemporal data (e.g., full velocity field) or a set of parameters and thresholds arbitrarily chosen by the user, the present network-based approach is able to identify the onset markers for transition by means of the streamwise velocity time-series alone.

AI Key Findings

Generated Sep 02, 2025

Methodology

The research employs visibility analysis of velocity time-series from a flat plate boundary layer to study transition to turbulence. Visibility graphs are constructed from these time-series, and network science metrics are used to represent underlying flow properties, enabling the identification of transition onset markers using streamwise velocity time-series alone.

Key Results

  • The visibility graph method accurately encodes the interplay of scales in the transition from laminar to turbulent flow.
  • Assortativity (r) peaks in the region of the domain preceding the rise of developed turbulence, serving as a reliable onset marker for transition.
  • The method does not require prior knowledge of the velocity field and can be applied using only streamwise velocity components from single-point measurements.

Significance

This research provides a novel, parameter-free approach to identify the onset of turbulence in boundary layers, which can be valuable for understanding and predicting transition in various fluid dynamics scenarios.

Technical Contribution

The paper introduces a network-based method using visibility graphs to analyze boundary layer transition, providing a reduced-order representation of flow properties through standard network metrics.

Novelty

The approach differs from existing methods by not requiring extensive spatiotemporal data or arbitrary user-defined parameters, and it identifies transition onset markers directly from streamwise velocity time-series.

Limitations

  • The method was validated using numerically simulated data; experimental validation is needed for broader applicability.
  • The approach may not capture all nuances of complex turbulent flows, especially those with highly anisotropic characteristics.

Future Work

  • Extend the method to experimental data from wind tunnels or water channels for validation.
  • Investigate the applicability of the visibility graph method to other types of fluid flow transitions, such as those in complex geometries or under varying pressure gradients.

Paper Details

PDF Preview

Download PDF

Key Terms

turbulence (0.283)
time series (0.272)
flow (0.213)
series (0.213)
velocity (0.205)
means (0.171)
thresholds (0.151)
transition (0.150)

Citation Network

Current paper (gray), citations (green), references (blue)

Display is limited for performance on very large graphs.

Current Paper
Citations
References
Click to view
Title Authors Year Actions

Comments (0)

This website uses cookies to ensure you get the best experience. Learn more