VisMaker: a Question-Oriented Visualization Recommender System for Data Exploration
Publication
Metrics
AI Quick Summary
VisMaker is a visualization recommender system that helps users create useful data visualizations through a set of rules-based recommendations organized around questions. It aims to facilitate the exploration process and improve the development of tools in data visualization.
Paper Preview
Abstract
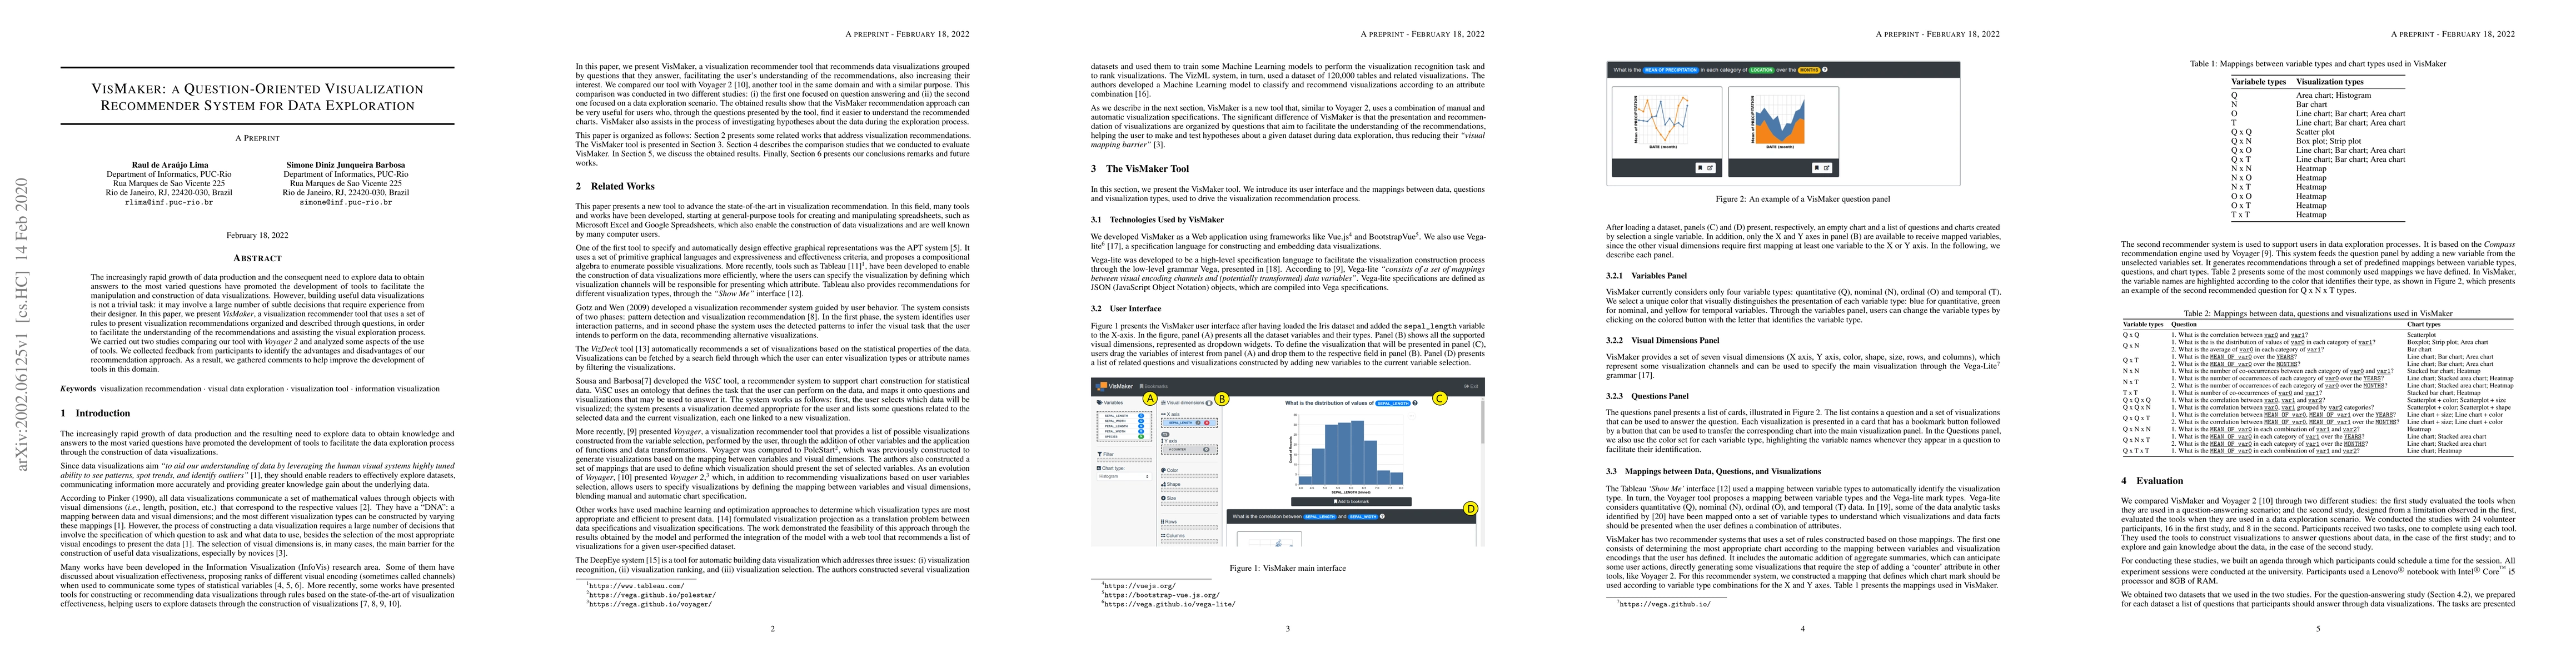
The increasingly rapid growth of data production and the consequent need to explore data to obtain answers to the most varied questions have promoted the development of tools to facilitate the manipulation and construction of data visualizations. However, building useful data visualizations is not a trivial task: it may involve a large number of subtle decisions that require experience from their designer. In this paper, we present VisMaker, a visualization recommender tool that uses a set of rules to present visualization recommendations organized and described through questions, in order to facilitate the understanding of the recommendations and assisting the visual exploration process. We carried out two studies comparing our tool with Voyager 2 and analyzed some aspects of the use of tools. We collected feedback from participants to identify the advantages and disadvantages of our recommendation approach. As a result, we gathered comments to help improve the development of tools in this domain.
AI Key Findings
Get AI-generated insights about this paper's methodology, results, significance, and more — seven facets brought into focus.
Impact
Paper Details
Authors
PDF Preview
Key Terms
Citation Network
Current paper (gray), citations (green), references (blue)
Display is limited for performance on very large graphs.
Discussion 0