VISPUR: Visual Aids for Identifying and Interpreting Spurious Associations in Data-Driven Decisions
Publication
Metrics
AI Quick Summary
VISPUR is a visual analytic system designed to help identify and interpret spurious associations in data-driven decisions, featuring a CONFOUNDER DASHBOARD, SUBGROUP VIEWER, REASONING STORYBOARD, and DECISION DIAGNOSIS panel. Evaluations show it effectively aids in understanding and mitigating the pitfalls of spurious associations.
Paper Preview
Abstract
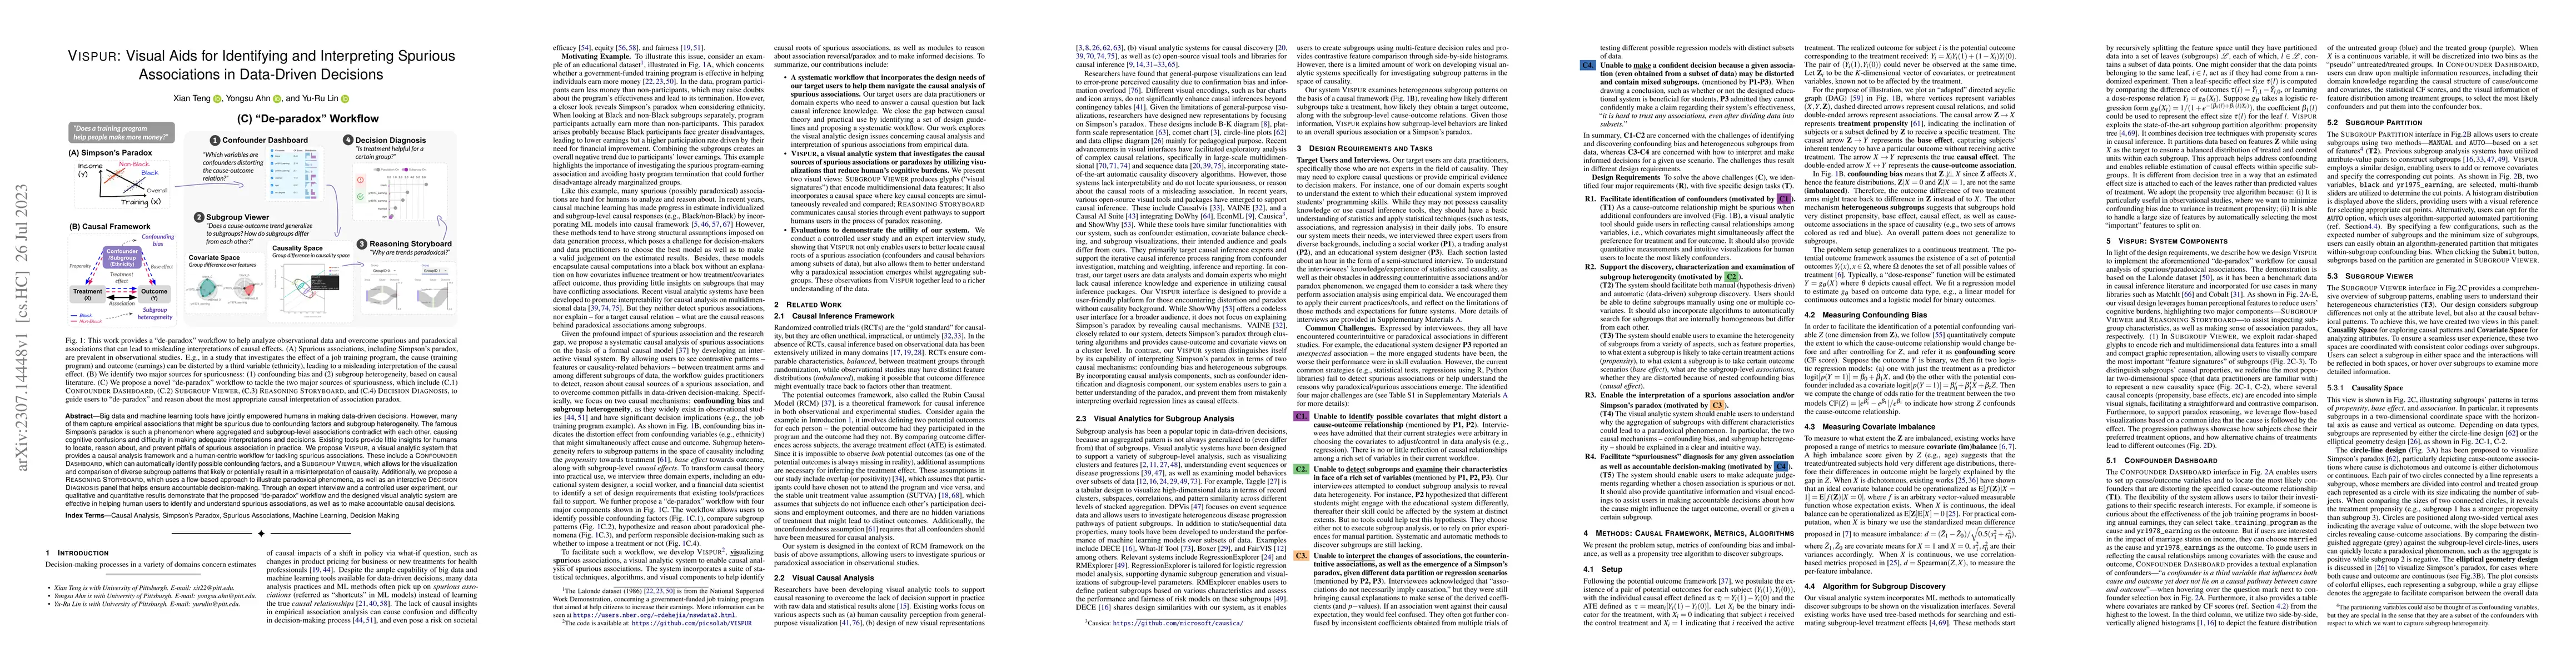
Big data and machine learning tools have jointly empowered humans in making data-driven decisions. However, many of them capture empirical associations that might be spurious due to confounding factors and subgroup heterogeneity. The famous Simpson's paradox is such a phenomenon where aggregated and subgroup-level associations contradict with each other, causing cognitive confusions and difficulty in making adequate interpretations and decisions. Existing tools provide little insights for humans to locate, reason about, and prevent pitfalls of spurious association in practice. We propose VISPUR, a visual analytic system that provides a causal analysis framework and a human-centric workflow for tackling spurious associations. These include a CONFOUNDER DASHBOARD, which can automatically identify possible confounding factors, and a SUBGROUP VIEWER, which allows for the visualization and comparison of diverse subgroup patterns that likely or potentially result in a misinterpretation of causality. Additionally, we propose a REASONING STORYBOARD, which uses a flow-based approach to illustrate paradoxical phenomena, as well as an interactive DECISION DIAGNOSIS panel that helps ensure accountable decision-making. Through an expert interview and a controlled user experiment, our qualitative and quantitative results demonstrate that the proposed "de-paradox" workflow and the designed visual analytic system are effective in helping human users to identify and understand spurious associations, as well as to make accountable causal decisions.
AI Key Findings
Get AI-generated insights about this paper's methodology, results, significance, and more — seven facets brought into focus.
Impact
Paper Details
Authors
PDF Preview
Key Terms
Citation Network
Current paper (gray), citations (green), references (blue)
Display is limited for performance on very large graphs.
Discussion 0