ViStruct: Simulating Expert-Like Reasoning Through Task Decomposition and Visual Attention Cues
Publication
Metrics
Paper Preview
Abstract
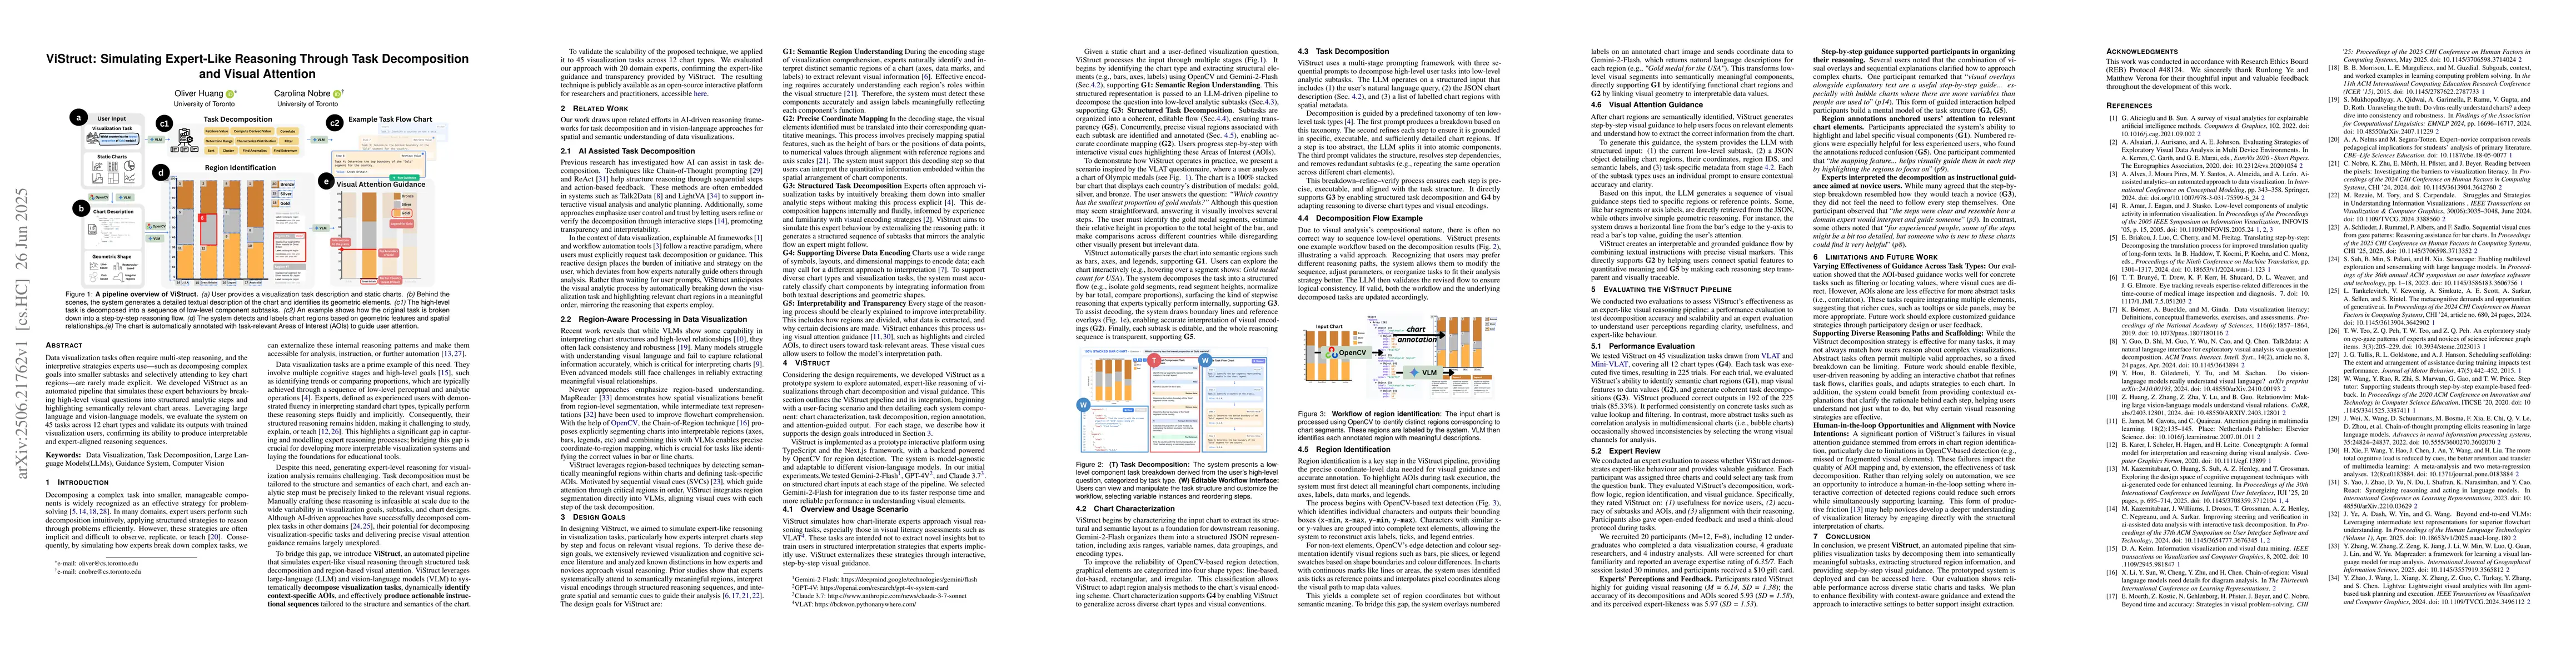
Data visualization tasks often require multi-step reasoning, and the interpretive strategies experts use, such as decomposing complex goals into smaller subtasks and selectively attending to key chart regions are rarely made explicit. ViStruct is an automated pipeline that simulates these expert behaviours by breaking high-level visual questions into structured analytic steps and highlighting semantically relevant chart areas. Leveraging large language and vision-language models, ViStruct identifies chart components, maps subtasks to spatial regions, and presents visual attention cues to externalize expert-like reasoning flows. While not designed for direct novice instruction, ViStruct provides a replicable model of expert interpretation that can inform the development of future visual literacy tools. We evaluate the system on 45 tasks across 12 chart types and validate its outputs with trained visualization users, confirming its ability to produce interpretable and expert-aligned reasoning sequences.
AI Key Findings
Get AI-generated insights about this paper's methodology, results, significance, and more — seven facets brought into focus.
Impact
Authors
PDF Preview
Citation Network
Current paper (gray), citations (green), references (blue)
Display is limited for performance on very large graphs.
Discussion 0