Visual analysis of bivariate dependence between continuous random variables
Publication
Metrics
AI Quick Summary
This paper explores the limitations of conventional scatter plots in analyzing bivariate dependence between continuous random variables, advocating instead for rank plots derived from ranked data. It introduces a new graphical tool, the dplot, and discusses its advantages in revealing dependence while avoiding information about marginal distributions.
Paper Preview
Abstract
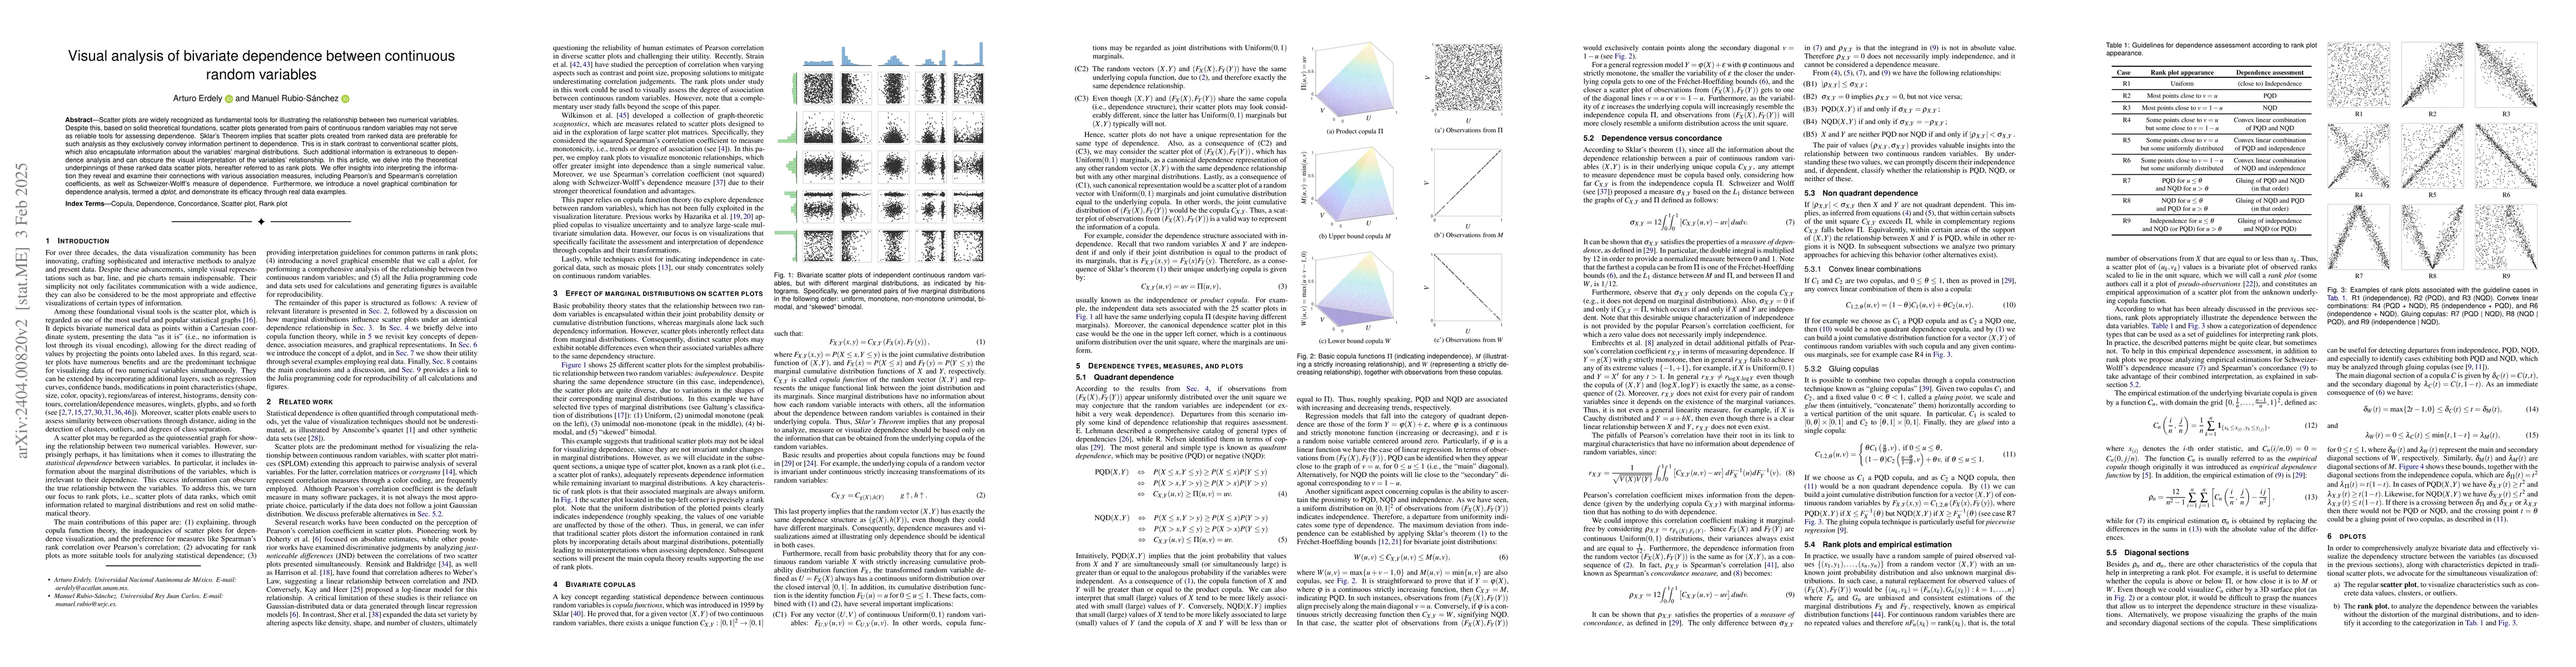
Scatter plots are widely recognized as fundamental tools for illustrating the relationship between two numerical variables. Despite this, based on solid theoretical foundations, scatter plots generated from pairs of continuous random variables may not serve as reliable tools for assessing dependence. Sklar's Theorem implies that scatter plots created from ranked data are preferable for such analysis as they exclusively convey information pertinent to dependence. This is in stark contrast to conventional scatter plots, which also encapsulate information about the variables' marginal distributions. Such additional information is extraneous to dependence analysis and can obscure the visual interpretation of the variables' relationship. In this article, we delve into the theoretical underpinnings of these ranked data scatter plots, hereafter referred to as rank plots. We offer insights into interpreting the information they reveal and examine their connections with various association measures, including Pearson's and Spearman's correlation coefficients, as well as Schweizer-Wolff's measure of dependence. Furthermore, we introduce a novel graphical combination for dependence analysis, termed a dplot, and demonstrate its efficacy through real data examples.
AI Key Findings
Get AI-generated insights about this paper's methodology, results, significance, and more — seven facets brought into focus.
Impact
Paper Details
Authors
PDF Preview
Key Terms
Citation Network
Current paper (gray), citations (green), references (blue)
Display is limited for performance on very large graphs.
Discussion 0