This paper presents a dynamic hierarchical aggregation technique for visualizing high-dimensional event sequence data, enabling users to interactively explore predefined event type hierarchies to determine the most informative levels of grouping. The method includes an algorithm for selecting optimal event groupings and a scatter-plus-focus visualization, applied in a medical cohort analysis tool to enhance data interpretation.
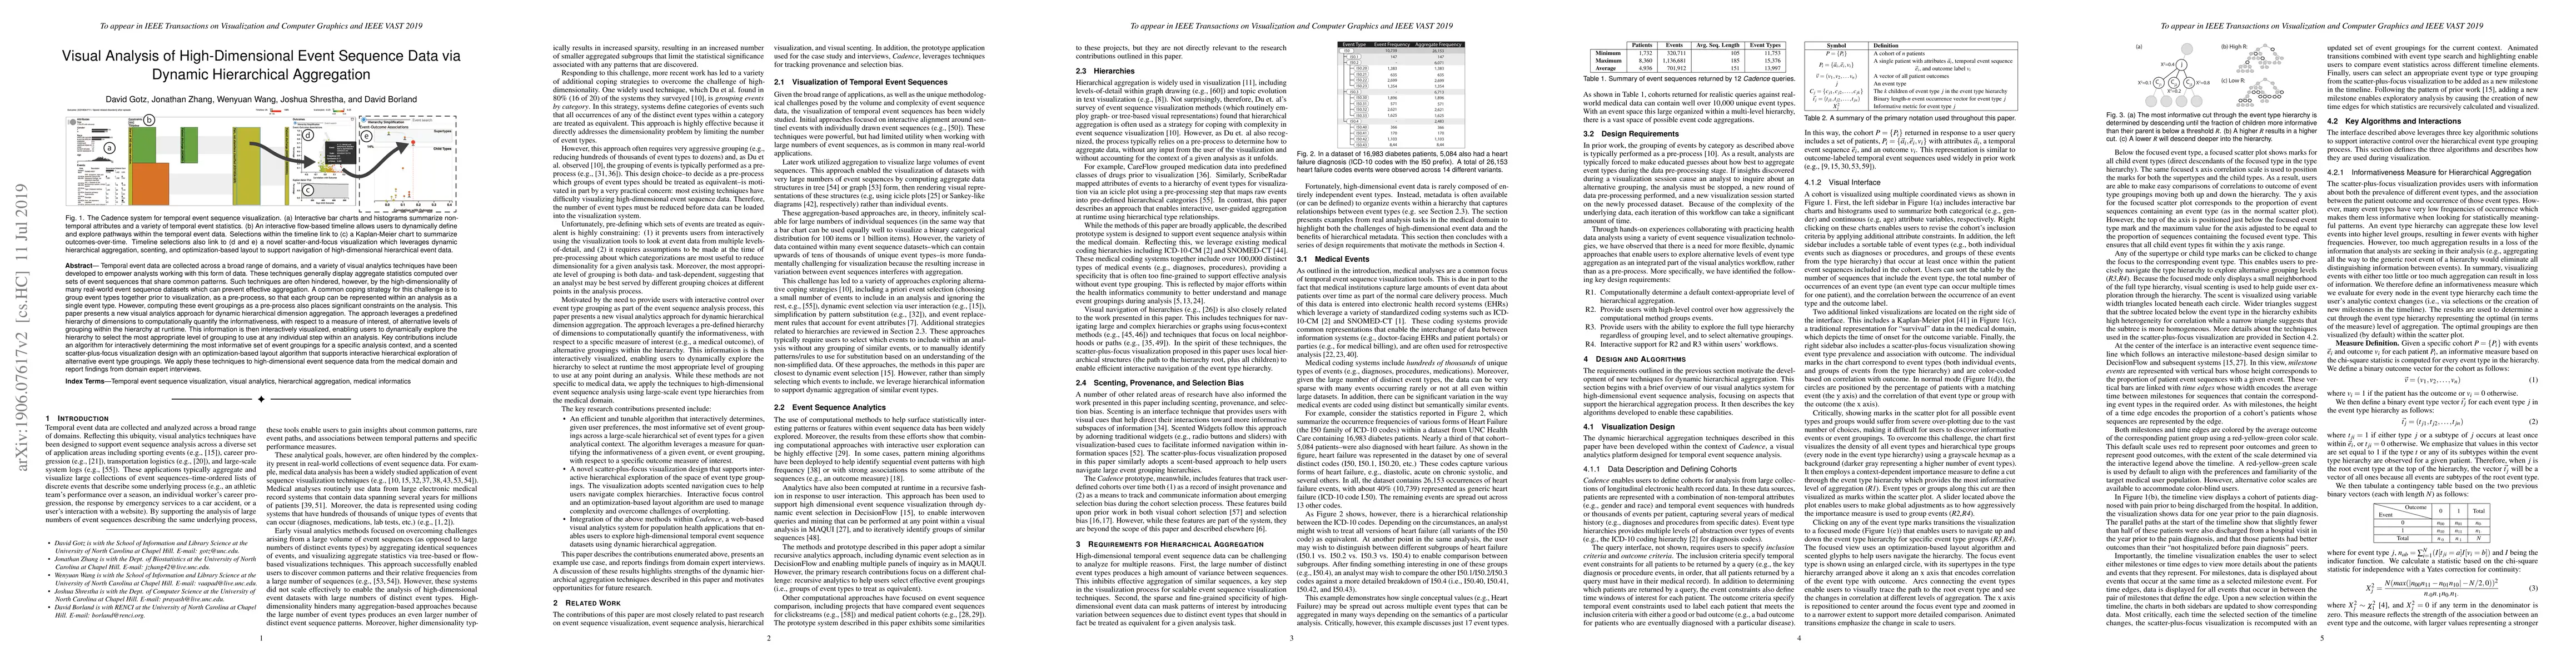
Temporal event data are collected across a broad range of domains, and a variety of visual analytics techniques have been developed to empower analysts working with this form of data. These techniques generally display aggregate statistics computed over sets of event sequences that share common patterns. Such techniques are often hindered, however, by the high-dimensionality of many real-world event sequence datasets because the large number of distinct event types within such data prevents effective aggregation. A common coping strategy for this challenge is to group event types together as a pre-process, prior to visualization, so that each group can be represented within an analysis as a single event type. However, computing these event groupings as a pre-process also places significant constraints on the analysis. This paper presents a dynamic hierarchical aggregation technique that leverages a predefined hierarchy of dimensions to computationally quantify the informativeness of alternative levels of grouping within the hierarchy at runtime. This allows users to dynamically explore the hierarchy to select the most appropriate level of grouping to use at any individual step within an analysis. Key contributions include an algorithm for interactively determining the most informative set of event groupings from within a large-scale hierarchy of event types, and a scatter-plus-focus visualization that supports interactive hierarchical exploration. While these contributions are generalizable to other types of problems, we apply them to high-dimensional event sequence analysis using large-scale event type hierarchies from the medical domain. We describe their use within a medical cohort analysis tool called Cadence, demonstrate an example in which the proposed technique supports better views of event sequence data, and report findings from domain expert interviews.
Get AI-generated insights about this paper's methodology, results, and significance.
Current paper (gray), citations (green), references (blue)
Qi Jiang, Ronghua Liang, Guodao Sun et al.
Title | Authors | Year | Actions |
---|---|---|---|
Comparing Native and Non-native English Speakers' Behaviors in Collaborative Writing through Visual Analytics
|
Yuexi Chen, Yimin Xiao, Kazi Tasnim Zinat, Naomi Yamashita, Ge Gao, Zhicheng Liu
|
2025
|
View Paper |
Visualization and analysis of the integration mechanism of artificial intelligence-enabled sports development and ecological environment protection
|
Yun Yang, Yuhu Zhao, Jianqiang Guo
|
2024
|
View Paper |
Drillboards: Adaptive Visualization Dashboards for Dynamic Personalization of Visualization Experiences
|
Sungbok Shin, Inyoup Na, Niklas Elmqvist
|
2024
|
View Paper |
A Multi-Level Task Framework for Event Sequence Analysis
|
Kazi Tasnim Zinat, Saimadhav Naga Sakhamuri, Aaron Sun Chen, Zhicheng Liu
|
2024
|
View Paper |
CompositingVis: Exploring Interactions for Creating Composite Visualizations in Immersive Environments
|
Qian Zhu, Tao Lu, Shunan Guo, Xiaojuan Ma, Yalong Yang
|
2024
|
View Paper |
A framework to improve causal inferences from visualizations using counterfactual operators
|
Arran Zeyu Wang, D. Borland, David Gotz
|
2024
|
View Paper |
IVESA – Visual Analysis of Time-Stamped Event Sequences
|
J. Bernard, Clara-Maria Barth, Eduard Cuba, Andrea Meier, Yasara Peiris, Ben Shneiderman
|
2024
|
View Paper |
SpaceEditing: A Latent Space Editing Interface for Integrating Human Knowledge into Deep Neural Networks
|
Jiafu Wei, Ding Xia, Haoran Xie, Chia-Ming Chang, Chuntao Li, Xi Yang
|
2024
|
View Paper |
An empirical study of counterfactual visualization to support visual causal inference
|
Arran Zeyu Wang, D. Borland, David Gotz
|
2024
|
View Paper |
A survey of immersive visualization: Focus on perception and interaction
|
Yue Zhang, Zhenyuan Wang, Jinhui Zhang, Guihua Shan, Dong Tian
|
2023
|
View Paper |
QEVIS: Multi-Grained Visualization of Distributed Query Execution
|
Qiaomu Shen, Zhengxin You, Xiao Yan, Chaozu Zhang, Ke Xu, Dan Zeng, Jianbin Qin, Bo Tang
|
2023
|
View Paper |
LiberRoad: Probing into the Journey of Chinese Classics Through Visual Analytics
|
Yuhan Guo, Yuchu Luo, Keer Lu, Linfang Li, Haizheng Yang, Xiaoru Yuan
|
2023
|
View Paper |
A survey of approaches for event sequence analysis and visualization
|
Anton Yeshchenko, Jan Mendling
|
2023
|
View Paper |
A Comparative Evaluation of Visual Summarization Techniques for Event Sequences
|
Kazi Tasnim Zinat, Jinhua Yang, Arjun Gandhi, Nistha Mitra, Zhicheng Liu
|
2023
|
View Paper |
SpaceEditing: Integrating Human Knowledge into Deep Neural Networks via Interactive Latent Space Editing
|
Jiafu Wei, Ding Xia, H. Xie, Chia-Ming Chang, Chuntao Li, Xi Yang
|
2022
|
View Paper |
A Data-Centric Methodology and Task Typology for Time-Stamped Event Sequences
|
Yasara Peiris, Clara-Maria Barth, Elaine M. Huang, J. Bernard
|
2022
|
View Paper |
BlockLens: Visual Analytics of Student Coding Behaviors in Block-Based Programming Environments
|
Sean Tsung, Huan Wei, Haotian Li, Yong Wang, Meng Xia, Huamin Qu
|
2022
|
View Paper |
A Survey of Approaches for Event Sequence Analysis and Visualization using the ESeVis Framework
|
Anton Yeshchenko, J. Mendling
|
2022
|
View Paper |
Explaining artificial intelligence with visual analytics in healthcare
|
Jeroen Ooge, G. Štiglic, K. Verbert
|
2021
|
View Paper |
Interactive Cohort Analysis and Hypothesis Discovery by Exploring Temporal Patterns in Population-Level Health Records
|
Tianyi Zhang, T. McCoy, R. Perlis, Elena L. Glassman
|
2021
|
View Paper |
Enabling Longitudinal Exploratory Analysis of Clinical COVID Data
|
D. Borland, Irena Brain, K. Fecho, E. Pfaff, Hao Xu, James Champion, C. Bizon, David Gotz
|
2021
|
View Paper |
Sequen-C: A Multilevel Overview of Temporal Event Sequences
|
J. Magallanes, Tony Stone, Paul D. Morris, Suzanne Mason, Steven Wood, M. Villa-Uriol
|
2021
|
View Paper |
Interpretable Anomaly Detection in Event Sequences via Sequence Matching and Visual Comparison
|
Shunan Guo, Zhuochen Jin, Qing Chen, D. Gotz, H. Zha, Nan Cao
|
2021
|
View Paper |
Exploring Multi‐dimensional Data via Subset Embedding
|
Peng Xie, Wenyuan Tao, Jie Li, Wentao Huang, Siming Chen
|
2021
|
View Paper |
Webbasierte Anwendung des Algorithm for Neighborhood Generating (ANG) zur Strukturierung und Analyse großer Datenmengen
|
Jozsef Sütö, Christina Klüver
|
2021
|
View Paper |
Modeling and Leveraging Analytic Focus During Exploratory Visual Analysis
|
Zhilan Zhou, Ximing Wen, Yue Wang, D. Gotz
|
2021
|
View Paper |
Co-Bridges: Pair-wise Visual Connection and Comparison for Multi-item Data Streams
|
Siming Chen, N. Andrienko, G. Andrienko, Jie Li, Xiaoru Yuan
|
2020
|
View Paper |
Selection-Bias-Corrected Visualization via Dynamic Reweighting
|
D. Borland, Jonathan Zhang, Smiti Kaul, D. Gotz
|
2020
|
View Paper |
Survey on Visual Analysis of Event Sequence Data
|
Yi Guo, Shunan Guo, Zhuochen Jin, Smiti Kaul, D. Gotz, Nan Cao
|
2020
|
View Paper |
Dynamic Hierarchical Aggregation, Selection Bias Tracking, and Detailed Subset Comparison for High-Dimensional Event Sequence Data
|
Jonathan Zhang, D. Borland, Wenyuan Wang, Joshua Shrestha, D. Gotz
|
2019
|
View Paper |
Selection Bias Tracking and Detailed Subset Comparison for High-Dimensional Data
|
D. Borland, Wenyuan Wang, Jonathan Zhang, Joshua Shrestha, D. Gotz
|
2019
|
View Paper |
DPVis: Visual Analytics With Hidden Markov Models for Disease Progression Pathways
|
Bum Chul Kwon, V. Anand, Kristen A. Severson, S. Ghosh, Zhaonan Sun, B. Frohnert, M. Lundgren, Kenney Ng
|
2019
|
View Paper |
Expanding the existing Cadence event sequence visual analysis tool to support the standardized data model OMOP CDM
|
Natthawut Adulyanukosol, David Gotz
|
2022
|
View Paper |
Visual Analytics to Combat Selection Bias in Retrospective EHR Data Analyses
|
D. Gotz, Jonathan Zhang, Smiti Kaul, G. Bobashev, D. Borland
|
2020
|
View Paper |
Comments (0)