Publication
Metrics
Paper Preview
Abstract
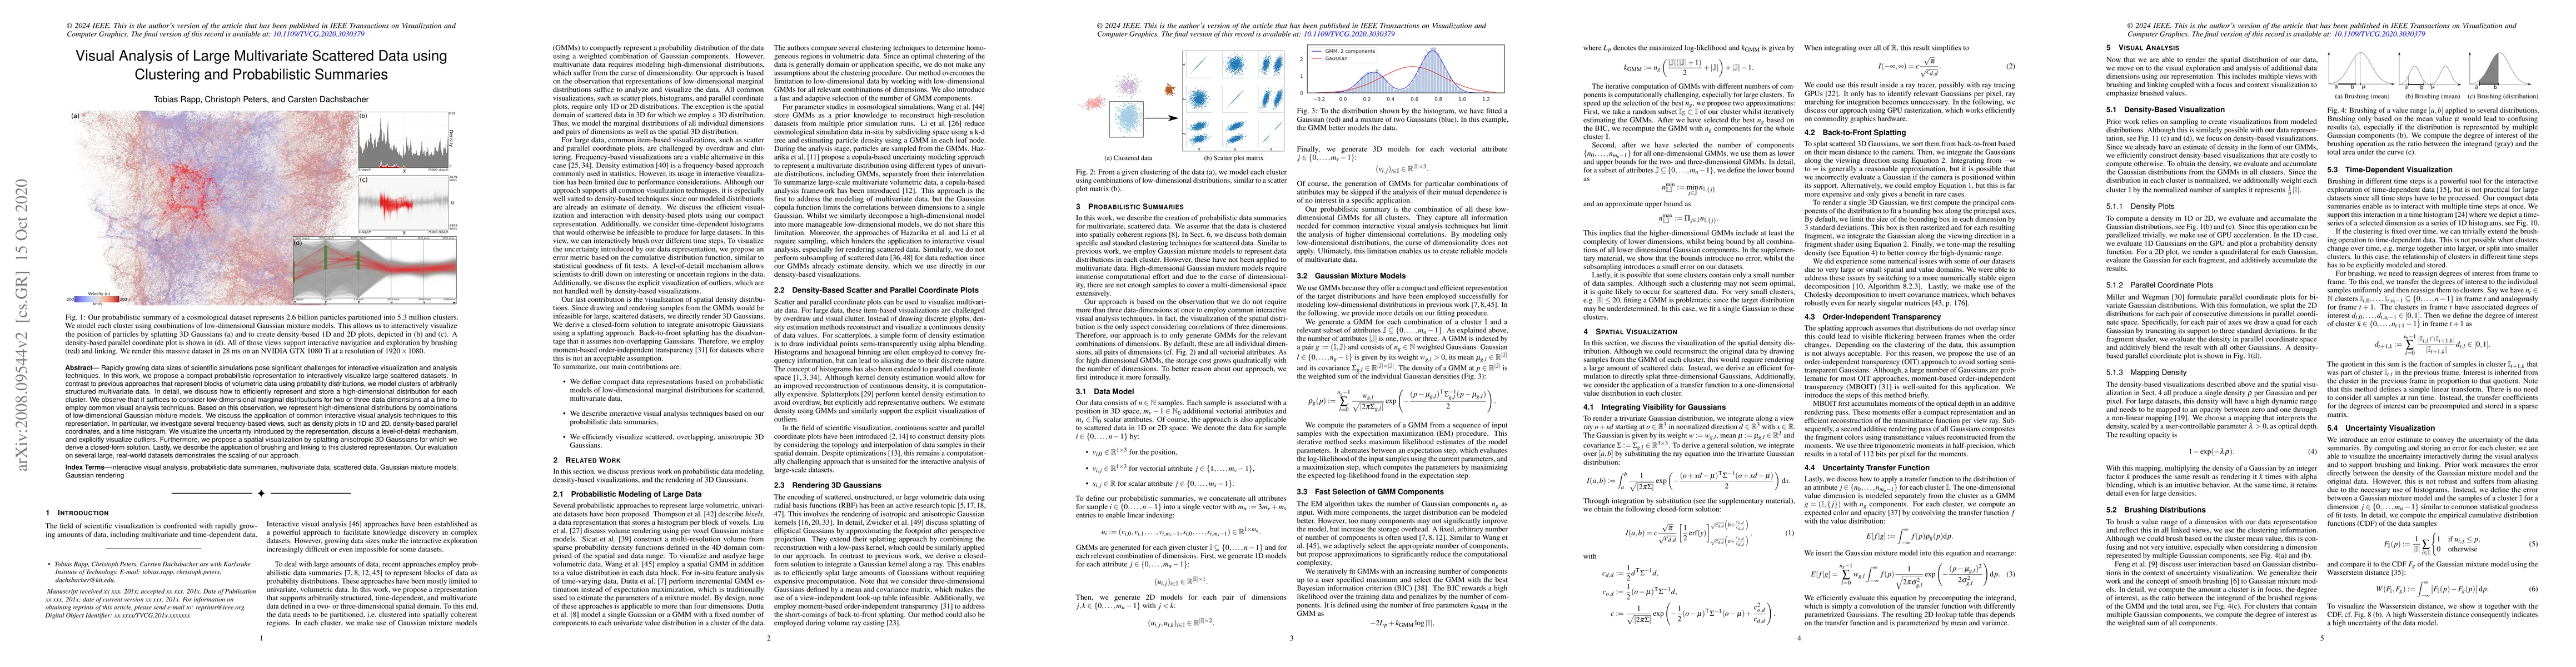
Rapidly growing data sizes of scientific simulations pose significant challenges for interactive visualization and analysis techniques. In this work, we propose a compact probabilistic representation to interactively visualize large scattered datasets. In contrast to previous approaches that represent blocks of volumetric data using probability distributions, we model clusters of arbitrarily structured multivariate data. In detail, we discuss how to efficiently represent and store a high-dimensional distribution for each cluster. We observe that it suffices to consider low-dimensional marginal distributions for two or three data dimensions at a time to employ common visual analysis techniques. Based on this observation, we represent high-dimensional distributions by combinations of low-dimensional Gaussian mixture models. We discuss the application of common interactive visual analysis techniques to this representation. In particular, we investigate several frequency-based views, such as density plots in 1D and 2D, density-based parallel coordinates, and a time histogram. We visualize the uncertainty introduced by the representation, discuss a level-of-detail mechanism, and explicitly visualize outliers. Furthermore, we propose a spatial visualization by splatting anisotropic 3D Gaussians for which we derive a closed-form solution. Lastly, we describe the application of brushing and linking to this clustered representation. Our evaluation on several large, real-world datasets demonstrates the scaling of our approach.
AI Key Findings
Get AI-generated insights about this paper's methodology, results, significance, and more — seven facets brought into focus.
Impact
Paper Details
PDF Preview
Key Terms
Citation Network
Current paper (gray), citations (green), references (blue)
Display is limited for performance on very large graphs.
Discussion 0