Visual Analytics of Conversational Dynamics
Publication
Metrics
Paper Preview
Abstract
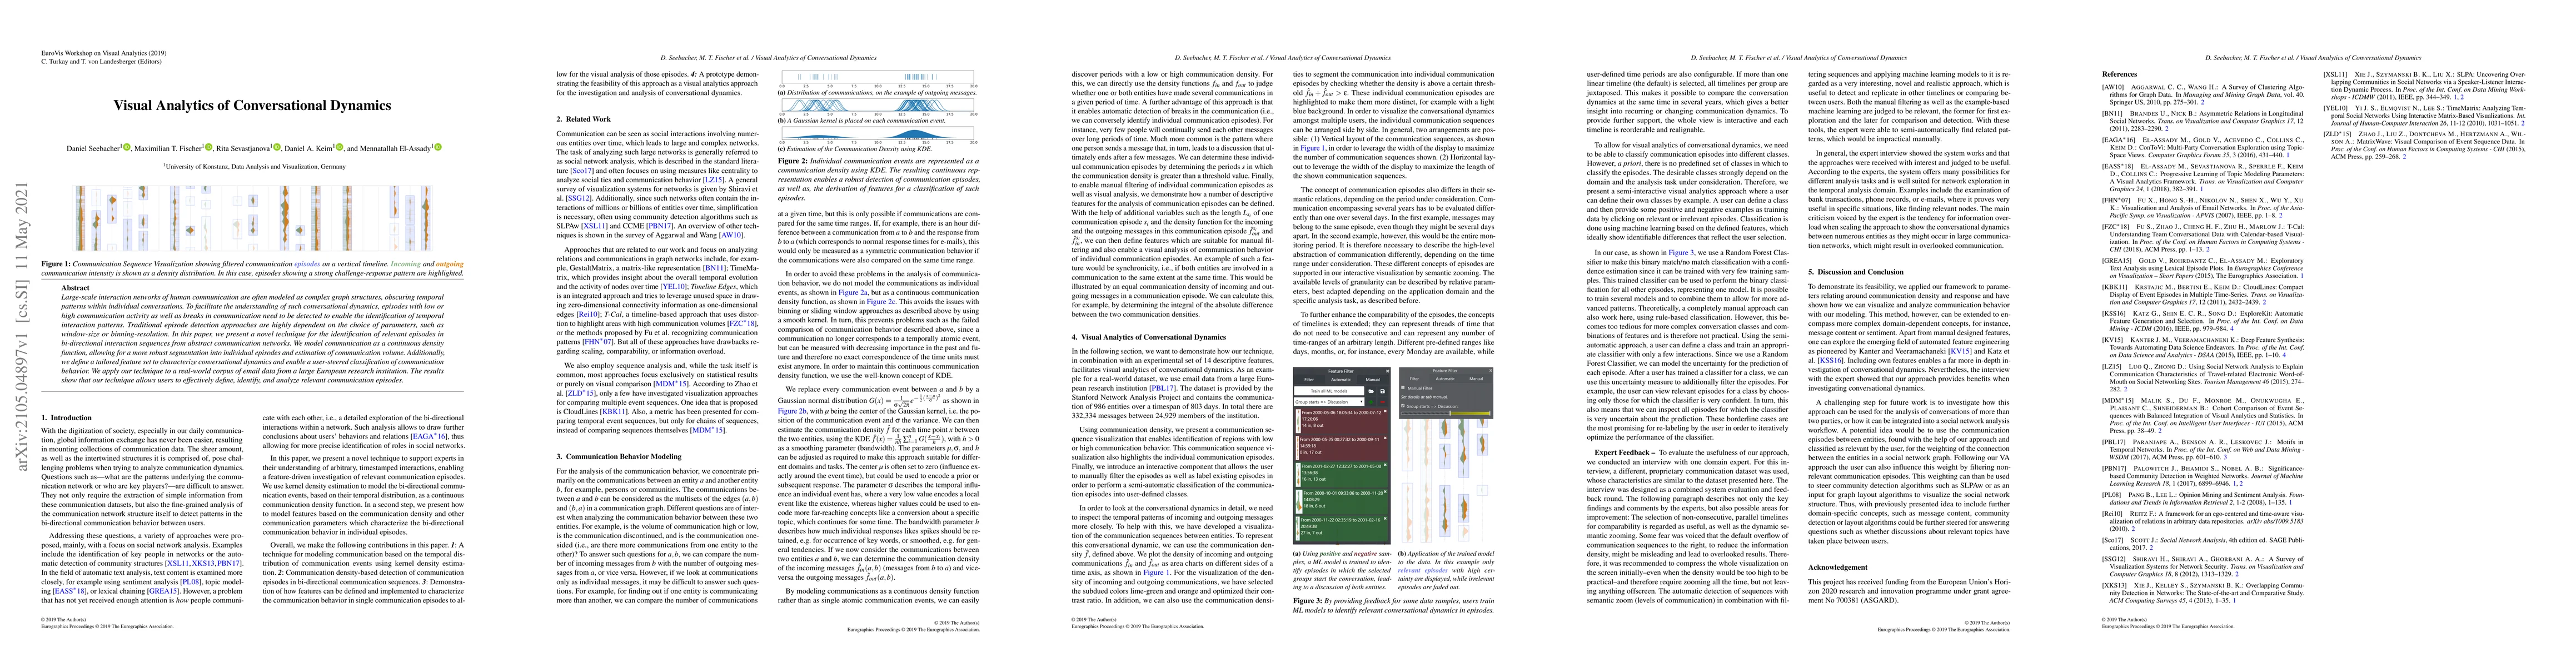
Large-scale interaction networks of human communication are often modeled as complex graph structures, obscuring temporal patterns within individual conversations. To facilitate the understanding of such conversational dynamics, episodes with low or high communication activity as well as breaks in communication need to be detected to enable the identification of temporal interaction patterns. Traditional episode detection approaches are highly dependent on the choice of parameters, such as window-size or binning-resolution. In this paper, we present a novel technique for the identification of relevant episodes in bi-directional interaction sequences from abstract communication networks. We model communication as a continuous density function, allowing for a more robust segmentation into individual episodes and estimation of communication volume. Additionally, we define a tailored feature set to characterize conversational dynamics and enable a user-steered classification of communication behavior. We apply our technique to a real-world corpus of email data from a large European research institution. The results show that our technique allows users to effectively define, identify, and analyze relevant communication episodes.
AI Key Findings
Get AI-generated insights about this paper's methodology, results, significance, and more — seven facets brought into focus.
Impact
Paper Details
Authors
PDF Preview
Key Terms
Citation Network
Current paper (gray), citations (green), references (blue)
Display is limited for performance on very large graphs.
Discussion 0