Quick Summary:

This paper introduces an interactive visual analysis workflow for comparing spatially-resolved omics-data across cohorts, facilitating the identification of cohort-differentiating features and outlier samples through various levels of cellular detail. The workflow was developed in consultation with domain experts and validated through case studies across different application areas.

Summary

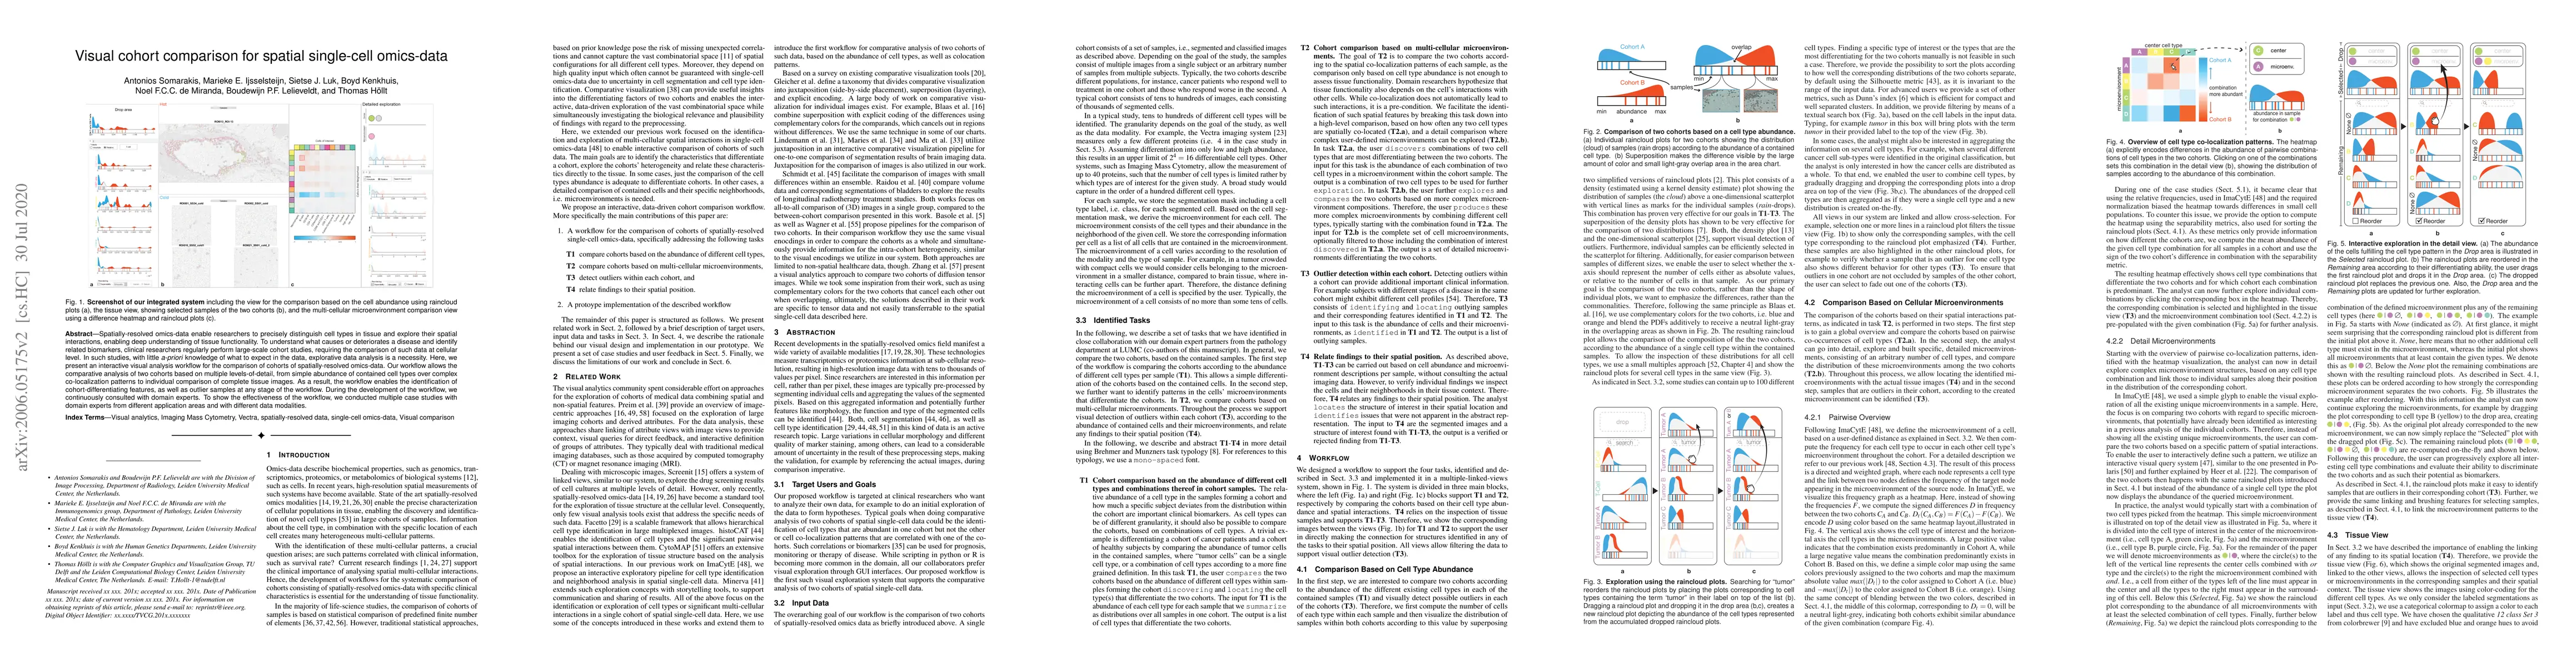
Spatially-resolved omics-data enable researchers to precisely distinguish cell types in tissue and explore their spatial interactions, enabling deep understanding of tissue functionality. To understand what causes or deteriorates a disease and identify related biomarkers, clinical researchers regularly perform large-scale cohort studies, requiring the comparison of such data at cellular level. In such studies, with little a-priori knowledge of what to expect in the data, explorative data analysis is a necessity. Here, we present an interactive visual analysis workflow for the comparison of cohorts of spatially-resolved omics-data. Our workflow allows the comparative analysis of two cohorts based on multiple levels-of-detail, from simple abundance of contained cell types over complex co-localization patterns to individual comparison of complete tissue images. As a result, the workflow enables the identification of cohort-differentiating features, as well as outlier samples at any stage of the workflow. During the development of the workflow, we continuously consulted with domain experts. To show the effectiveness of the workflow we conducted multiple case studies with domain experts from different application areas and with different data modalities.

AI Key Findings

Get AI-generated insights about this paper's methodology, results, and significance.

Paper Details

PDF Preview

Download PDF

Key Terms

experts (0.223)
researchers (0.196)
comparison (0.193)
resolved (0.192)
spatially (0.185)
cell (0.182)
studies (0.170)
types (0.154)
outlier (0.151)
data (0.150)
domain (0.150)
interactive (0.137)
multiple (0.136)
case studies (0.132)
analysis (0.131)
comparative (0.129)
modalities (0.127)
data analysis (0.127)
clinical (0.126)
disease (0.126)

Citation Network

Current paper (gray), citations (green), references (blue)

Current Paper
Citations
References
Click to view
Title Authors Year Actions
Aardvark: Composite Visualizations of Trees, Time-Series, and Images
Devin Lange, Robert L Judson-Torres, T. Zangle, Alexander Lex
2024
View Paper
Spatial omics techniques and data analysis for cancer immunotherapy applications.
Yue Zhang, Ren Yuan Lee, Chin Wee Tan, Xue Guo, W. Yim, Jeffrey CT Lim, Felicia Wee, WU Yang, Malvika Kharbanda, J. J. Lee, N. Ngo, W. Leow, L. Loo, Tony KH Lim, Radoslaw M Sobota, Mai Chan Lau, Melissa J. Davis, J. Yeong
2024
View Paper
Visualization and Visual Analytics Approaches for Image and Video Datasets: A Survey
S. Afzal, Sohaib Ghani, M. Hittawe, Sheikh Faisal Rashid, O. Knio, Markus Hadwiger, I. Hoteit
2023
View Paper
Insights into highly multiplexed tissue images: A primer for Mass Cytometry Imaging data analysis
Jing Zhao, Yaquan Liu, Mengmeng Wang, Junjie Ma, Pu Yang, Shunhao Wang, Qi Wu, Jiejun Gao, Mingli Chen, Guangbo Qu, Jianhua Wang, Guibin Jiang
2022
View Paper
Polyphony: an Interactive Transfer Learning Framework for Single-Cell Data Analysis
Furui Cheng, M. Keller, Huamin Qu, Nils Gehlenborg, Qianwen Wang
2022
View Paper
Not As Easy As You Think - Experiences and Lessons Learnt from Trying to Create a Bottom-Up Visualization Image Typology
Jian Chen, Petra Isenberg, R. Laramee, Tobias Isenberg, M. Sedlmair, Torsten Moeller, Han-Wei Shen
2022
View Paper
Trends & Opportunities in Visualization for Physiology: A Multiscale Overview
L. Garrison, I. Kolesár, I. Viola, H. Hauser, S. Bruckner
2022
View Paper
Visinity: Visual Spatial Neighborhood Analysis for Multiplexed Tissue Imaging Data
Simon Warchol, Robert Krueger, A. Nirmal, Giorgio Gaglia, Jared Jessup, Cecily C. Ritch, J. Hoffer, J. Muhlich, Megan L. Burger, Tyler Jacks, S. Santagata, P. Sorger, H. Pfister
2022
View Paper
Scope2Screen: Focus+Context Techniques for Pathology Tumor Assessment in Multivariate Image Data
Jared Jessup, Robert Krueger, Simon Warchol, J. Hoffer, J. Muhlich, Cecily C. Ritch, Giorgio Gaglia, S. Coy, Yu-An Chen, Jia-Ren Lin, S. Santagata, P. Sorger, H. Pfister
2021
View Paper
Iron loading is a prominent feature of activated microglia in Alzheimer’s disease patients
Boyd Kenkhuis, A. Somarakis, Lorraine M de Haan, O. Dzyubachyk, M. Ijsselsteijn, N. D. de Miranda, B. Lelieveldt, J. Dijkstra, W. V. van Roon-Mom, T. Höllt, L. van der Weerd
2021
View Paper
Iron loading is a prominent feature of activated microglia in Alzheimer’s disease patients
Boyd Kenkhuis, A. Somarakis, Lorraine M de Haan, O. Dzyubachyk, M. Ijsselsteijn, N. D. de Miranda, B. Lelieveldt, J. Dijkstra, W. V. van Roon-Mom, T. Höllt, L. van der Weerd
2021
View Paper
Cytosplore Simian Viewer: Visual Exploration for Multi-Species Single-Cell RNA Sequencing Data
Soumyadeep Basu, Jeroen Eggermont, Thomas Kroes, Nikolas L. Jorstad, Trygve E Bakken, E. Lein, B. Lelieveldt, T. Höllt
2023
View Paper
Visual Analysis of Tissue Images at Cellular Level
A. Somarakis, M. Ijsselsteijn, Boyd Kenkhuis, V. V. Unen, S. Luk, F. Koning, L. Weerd, N. Miranda, B. Lelieveldt, T. Höllt
2021
View Paper

Comments (0)

This website uses cookies to ensure you get the best experience. Learn more