Publication
Metrics
AI Quick Summary
Researchers used visual entropy to create an ordered scale of glyphs for representing uncertainty in 2D and 3D data, with most participants accurately ordering glyphs based on their complexity.
Paper Preview
Abstract
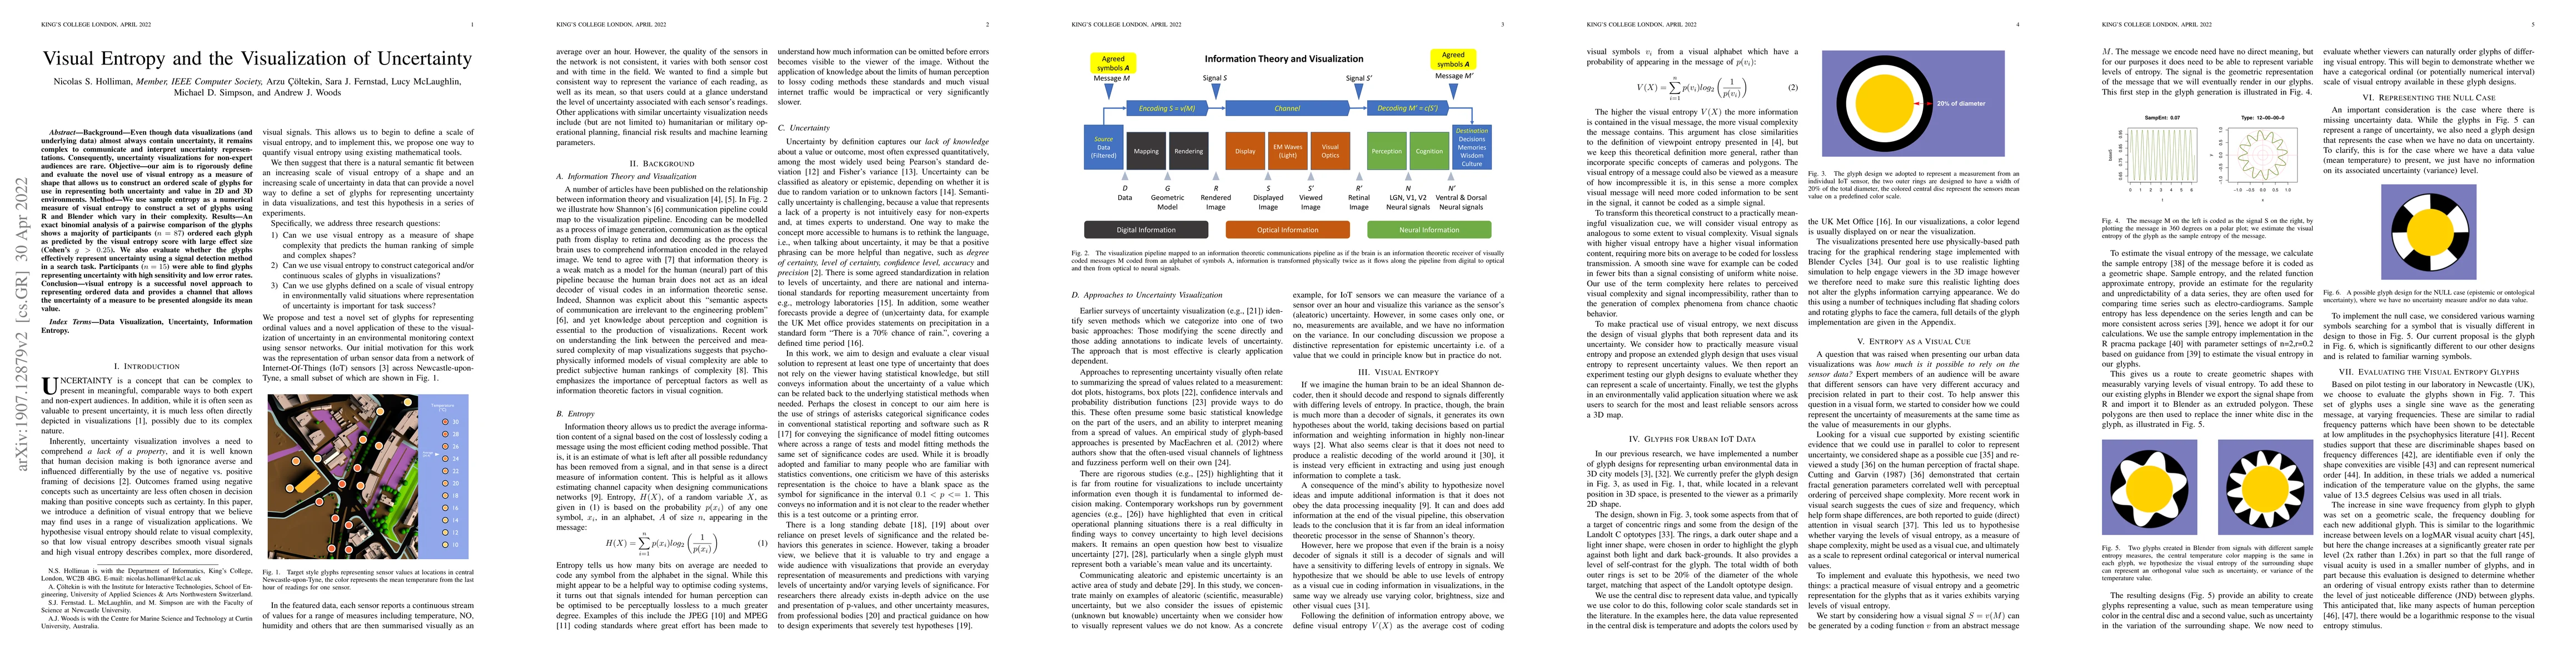
Background: Even though data visualizations (and underlying data) almost always contain uncertainty, it remains complex to communicate and interpret uncertainty representations. Consequently, uncertainty visualizations for non-expert audiences are rare. Objective: our aim is to rigorously define and evaluate the novel use of visual entropy as a measure of shape that allows us to construct an ordered scale of glyphs for use in representing both uncertainty and value in 2D and 3D environments. Method: We use sample entropy as a numerical measure of visual entropy to construct a set of glyphs using R and Blender which vary in their complexity. Results: an exact binomial analysis of a pairwise comparison of the glyphs shows a majority of participants (n = 87) ordered each glyph as predicted by the visual entropy score with large effect size (Cohen's g > 0.25). We also evaluate whether the glyphs effectively represent uncertainty using a signal detection method in a search task. Participants (n = 15) were able to find glyphs representing uncertainty with high sensitivity and low error rates. Conclusion: visual entropy is a successful novel approach to representing ordered data and provides a channel that can allow the uncertainty of a measure to be presented alongside its mean value.
AI Key Findings
Get AI-generated insights about this paper's methodology, results, significance, and more — seven facets brought into focus.
Impact
Paper Details
Authors
PDF Preview
Key Terms
Citation Network
Current paper (gray), citations (green), references (blue)
Display is limited for performance on very large graphs.
Discussion 0