Publication
Metrics
AI Quick Summary
Researchers propose a framework to visually explain deep metric learning models, providing insights into how image regions contribute to similarity, with applications in cross-view pattern discovery and interactive retrieval.
Paper Preview
Abstract
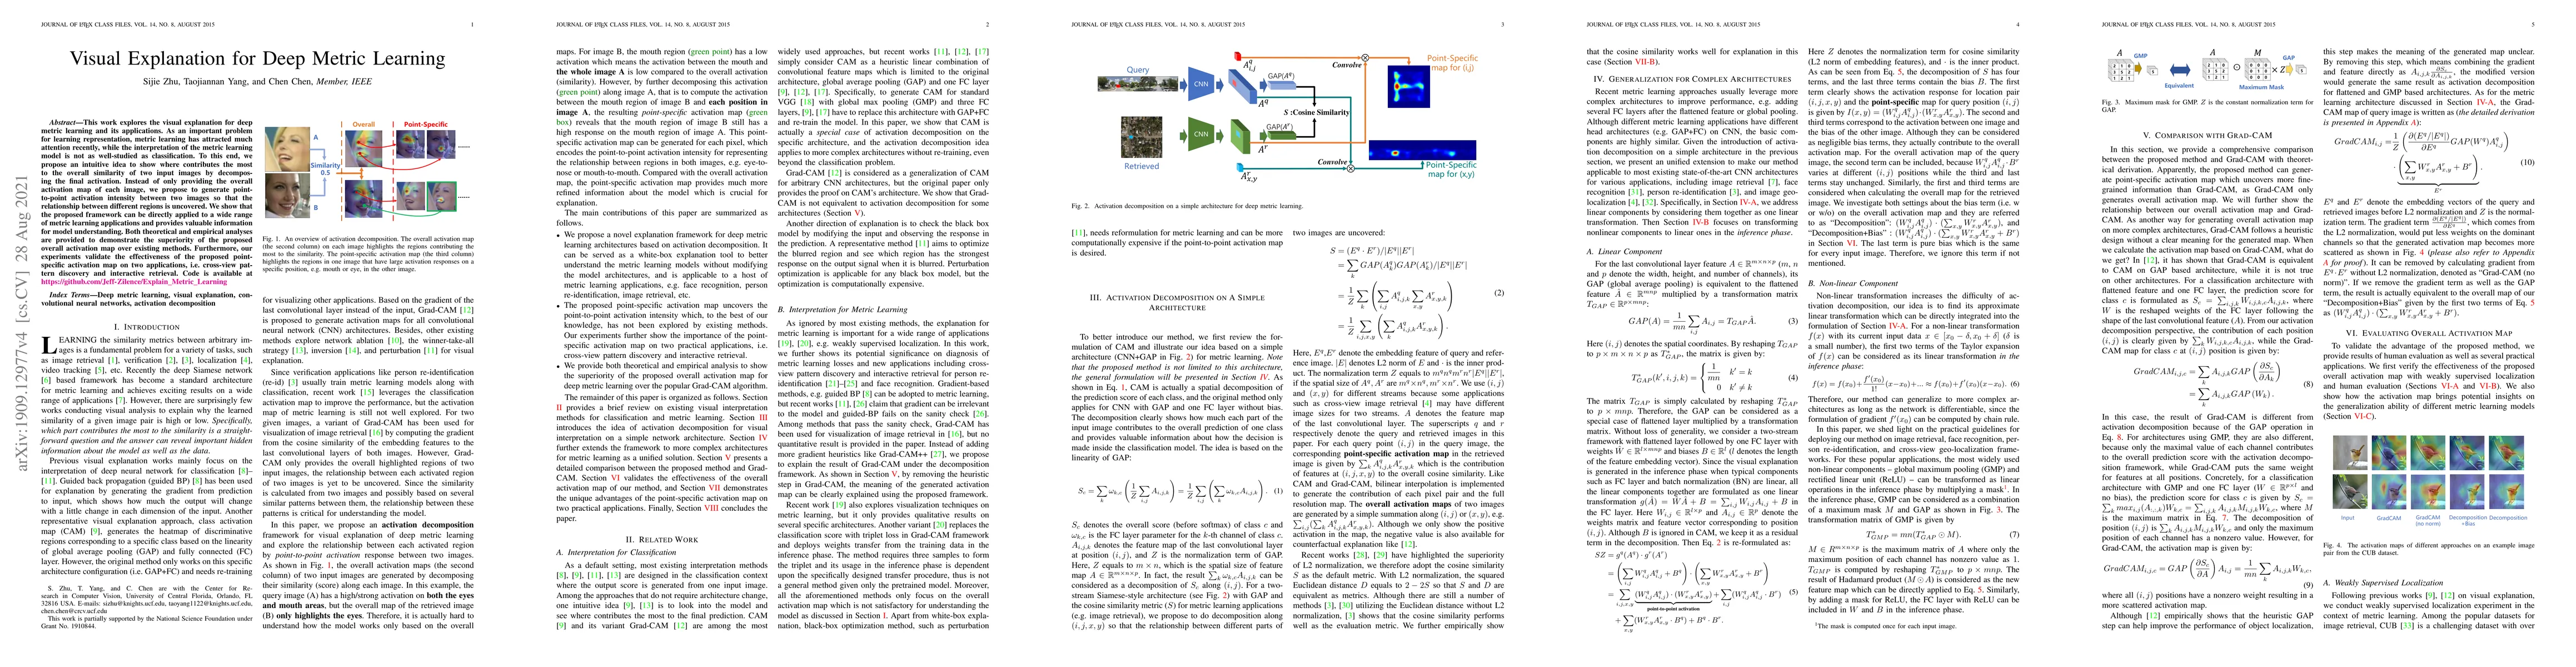
This work explores the visual explanation for deep metric learning and its applications. As an important problem for learning representation, metric learning has attracted much attention recently, while the interpretation of such model is not as well studied as classification. To this end, we propose an intuitive idea to show where contributes the most to the overall similarity of two input images by decomposing the final activation. Instead of only providing the overall activation map of each image, we propose to generate point-to-point activation intensity between two images so that the relationship between different regions is uncovered. We show that the proposed framework can be directly deployed to a large range of metric learning applications and provides valuable information for understanding the model. Furthermore, our experiments show its effectiveness on two potential applications, i.e. cross-view pattern discovery and interactive retrieval. The source code is available at \url{https://github.com/Jeff-Zilence/Explain_Metric_Learning}.
AI Key Findings
Get AI-generated insights about this paper's methodology, results, significance, and more — seven facets brought into focus.
Impact
Paper Details
Authors
PDF Preview
Key Terms
Citation Network
Current paper (gray), citations (green), references (blue)
Display is limited for performance on very large graphs.
Discussion 0