Visual Explanations with Attributions and Counterfactuals on Time Series Classification
Publication
Metrics
AI Quick Summary
This paper proposes a visual analytics workflow for explainable AI in time series classification, integrating global and local explanations through attributions and counterfactuals. It adapts local XAI techniques to time series data, providing a comprehensive overview and enabling what-if analysis for improved model understanding and error detection.
Paper Preview
Abstract
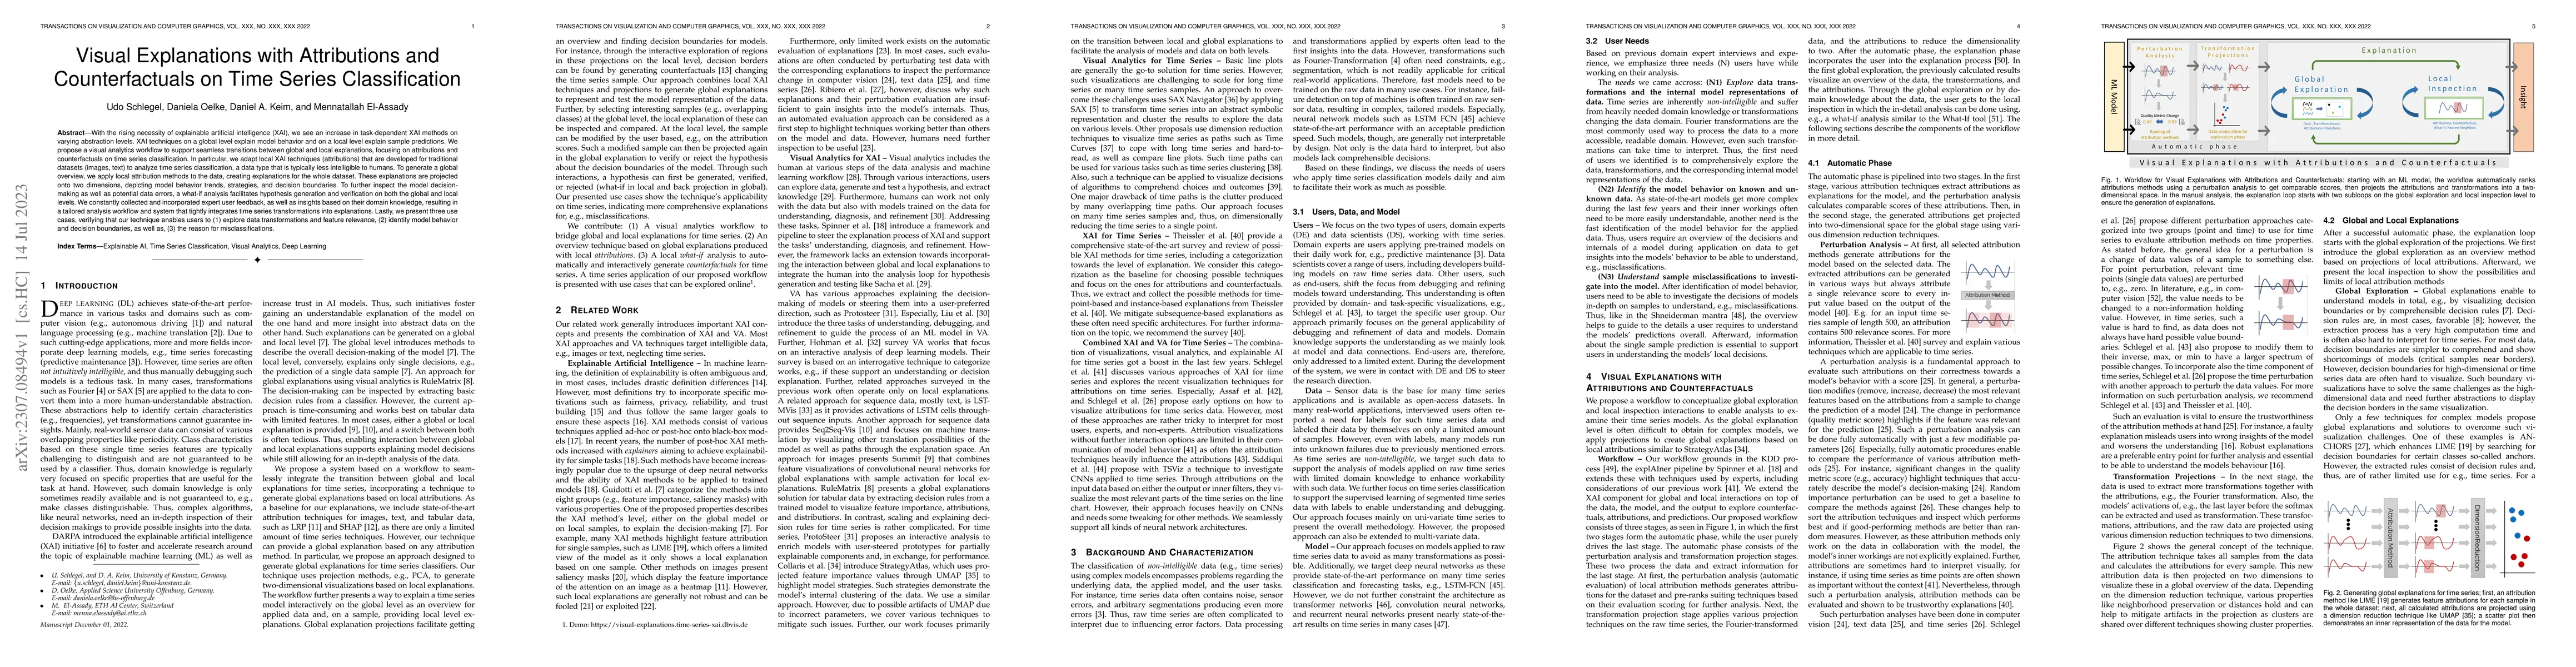
With the rising necessity of explainable artificial intelligence (XAI), we see an increase in task-dependent XAI methods on varying abstraction levels. XAI techniques on a global level explain model behavior and on a local level explain sample predictions. We propose a visual analytics workflow to support seamless transitions between global and local explanations, focusing on attributions and counterfactuals on time series classification. In particular, we adapt local XAI techniques (attributions) that are developed for traditional datasets (images, text) to analyze time series classification, a data type that is typically less intelligible to humans. To generate a global overview, we apply local attribution methods to the data, creating explanations for the whole dataset. These explanations are projected onto two dimensions, depicting model behavior trends, strategies, and decision boundaries. To further inspect the model decision-making as well as potential data errors, a what-if analysis facilitates hypothesis generation and verification on both the global and local levels. We constantly collected and incorporated expert user feedback, as well as insights based on their domain knowledge, resulting in a tailored analysis workflow and system that tightly integrates time series transformations into explanations. Lastly, we present three use cases, verifying that our technique enables users to (1)~explore data transformations and feature relevance, (2)~identify model behavior and decision boundaries, as well as, (3)~the reason for misclassifications.
AI Key Findings
Get AI-generated insights about this paper's methodology, results, significance, and more — seven facets brought into focus.
Impact
Paper Details
Authors
PDF Preview
Key Terms
Citation Network
Current paper (gray), citations (green), references (blue)
Display is limited for performance on very large graphs.
Discussion 0