Visual Exploration and Knowledge Discovery from Biomedical Dark Data
Publication
Metrics
AI Quick Summary
This research explores data visualization techniques to extract insights from biomedical dark data, specifically using PubMed's extensive citation corpus. It employs NLP and lexical analysis to uncover trends, relationships, and key topics, aiming to enhance decision-making and knowledge discovery in the face of overwhelming data volumes.
Paper Preview
Abstract
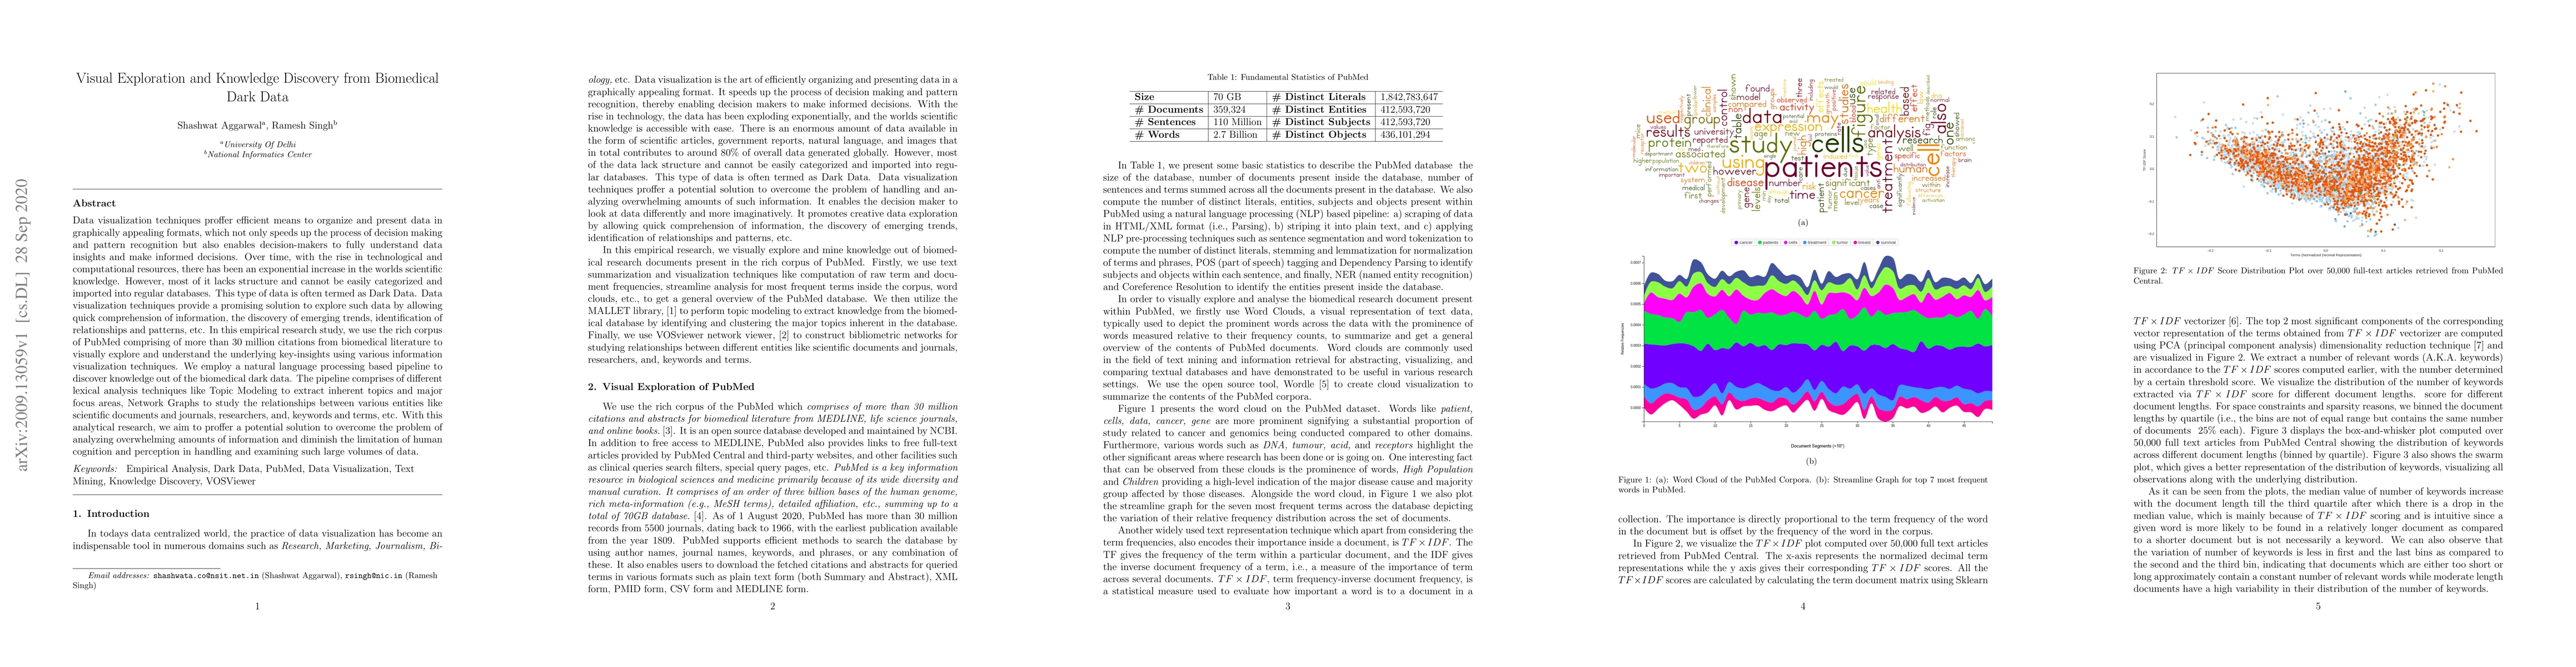
Data visualization techniques proffer efficient means to organize and present data in graphically appealing formats, which not only speeds up the process of decision making and pattern recognition but also enables decision-makers to fully understand data insights and make informed decisions. Over time, with the rise in technological and computational resources, there has been an exponential increase in the world's scientific knowledge. However, most of it lacks structure and cannot be easily categorized and imported into regular databases. This type of data is often termed as Dark Data. Data visualization techniques provide a promising solution to explore such data by allowing quick comprehension of information, the discovery of emerging trends, identification of relationships and patterns, etc. In this empirical research study, we use the rich corpus of PubMed comprising of more than 30 million citations from biomedical literature to visually explore and understand the underlying key-insights using various information visualization techniques. We employ a natural language processing based pipeline to discover knowledge out of the biomedical dark data. The pipeline comprises of different lexical analysis techniques like Topic Modeling to extract inherent topics and major focus areas, Network Graphs to study the relationships between various entities like scientific documents and journals, researchers, and, keywords and terms, etc. With this analytical research, we aim to proffer a potential solution to overcome the problem of analyzing overwhelming amounts of information and diminish the limitation of human cognition and perception in handling and examining such large volumes of data.
AI Key Findings
Get AI-generated insights about this paper's methodology, results, significance, and more — seven facets brought into focus.
Impact
Paper Details
Authors
PDF Preview
Key Terms
Citation Network
Current paper (gray), citations (green), references (blue)
Display is limited for performance on very large graphs.
Discussion 0