Publication
Metrics
Paper Preview
Abstract
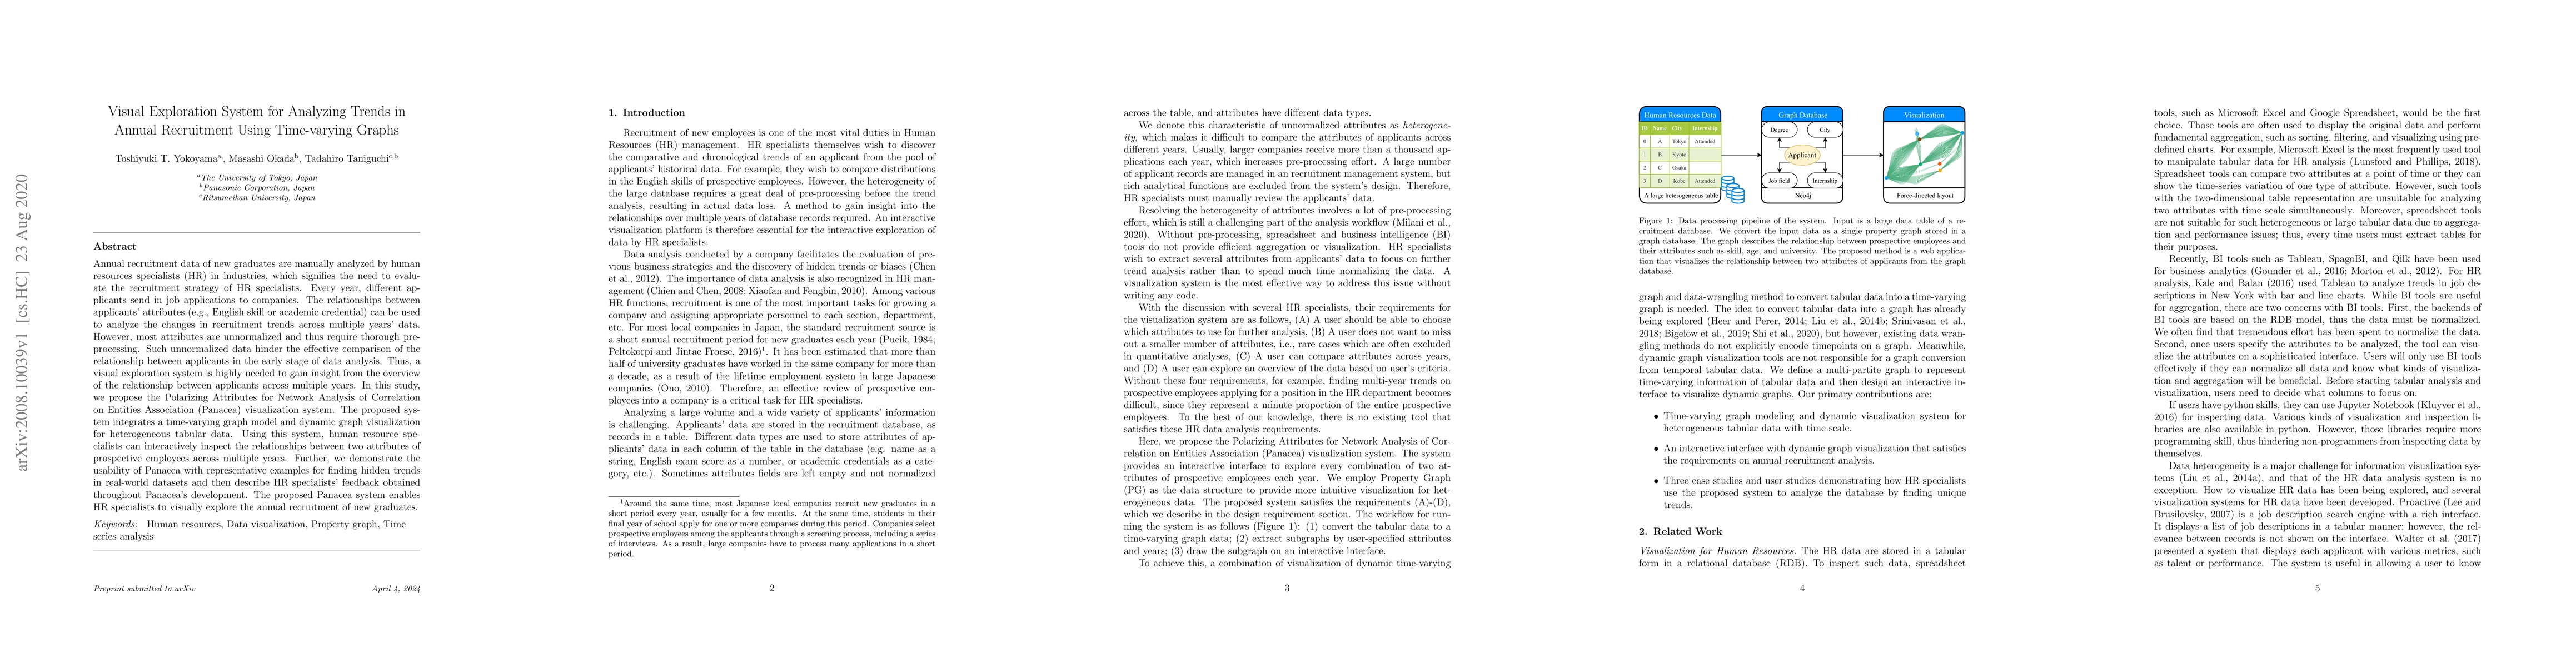
Annual recruitment data of new graduates are manually analyzed by human resources specialists (HR) in industries, which signifies the need to evaluate the recruitment strategy of HR specialists. Every year, different applicants send in job applications to companies. The relationships between applicants' attributes (e.g., English skill or academic credential) can be used to analyze the changes in recruitment trends across multiple years' data. However, most attributes are unnormalized and thus require thorough preprocessing. Such unnormalized data hinder the effective comparison of the relationship between applicants in the early stage of data analysis. Thus, a visual exploration system is highly needed to gain insight from the overview of the relationship between applicants across multiple years. In this study, we propose the Polarizing Attributes for Network Analysis of Correlation on Entities Association (Panacea) visualization system. The proposed system integrates a time-varying graph model and dynamic graph visualization for heterogeneous tabular data. Using this system, human resource specialists can interactively inspect the relationships between two attributes of prospective employees across multiple years. Further, we demonstrate the usability of Panacea with representative examples for finding hidden trends in real-world datasets and then describe HR specialists' feedback obtained throughout Panacea's development. The proposed Panacea system enables HR specialists to visually explore the annual recruitment of new graduates.
AI Key Findings
Get AI-generated insights about this paper's methodology, results, significance, and more — seven facets brought into focus.
Impact
Paper Details
Authors
PDF Preview
Key Terms
Citation Network
Current paper (gray), citations (green), references (blue)
Display is limited for performance on very large graphs.
Discussion 0