Visual Mining of Epidemic Networks
1210.5694
International Work Conference on Artificial Neural Networks,
Torremolinos : Spain (2011)
DOI: 10.1007/978-3-642-21498-1_35
Published Oct 23, 2012
10 citations
Publication
Published:
Oct 23, 2012
Updated:
Jun 02, 2025
Categories:
stat.AP, cs.SI, physics.soc-ph
Metrics
Citations:
10
Source:
ArXiv
Paper Preview
Abstract
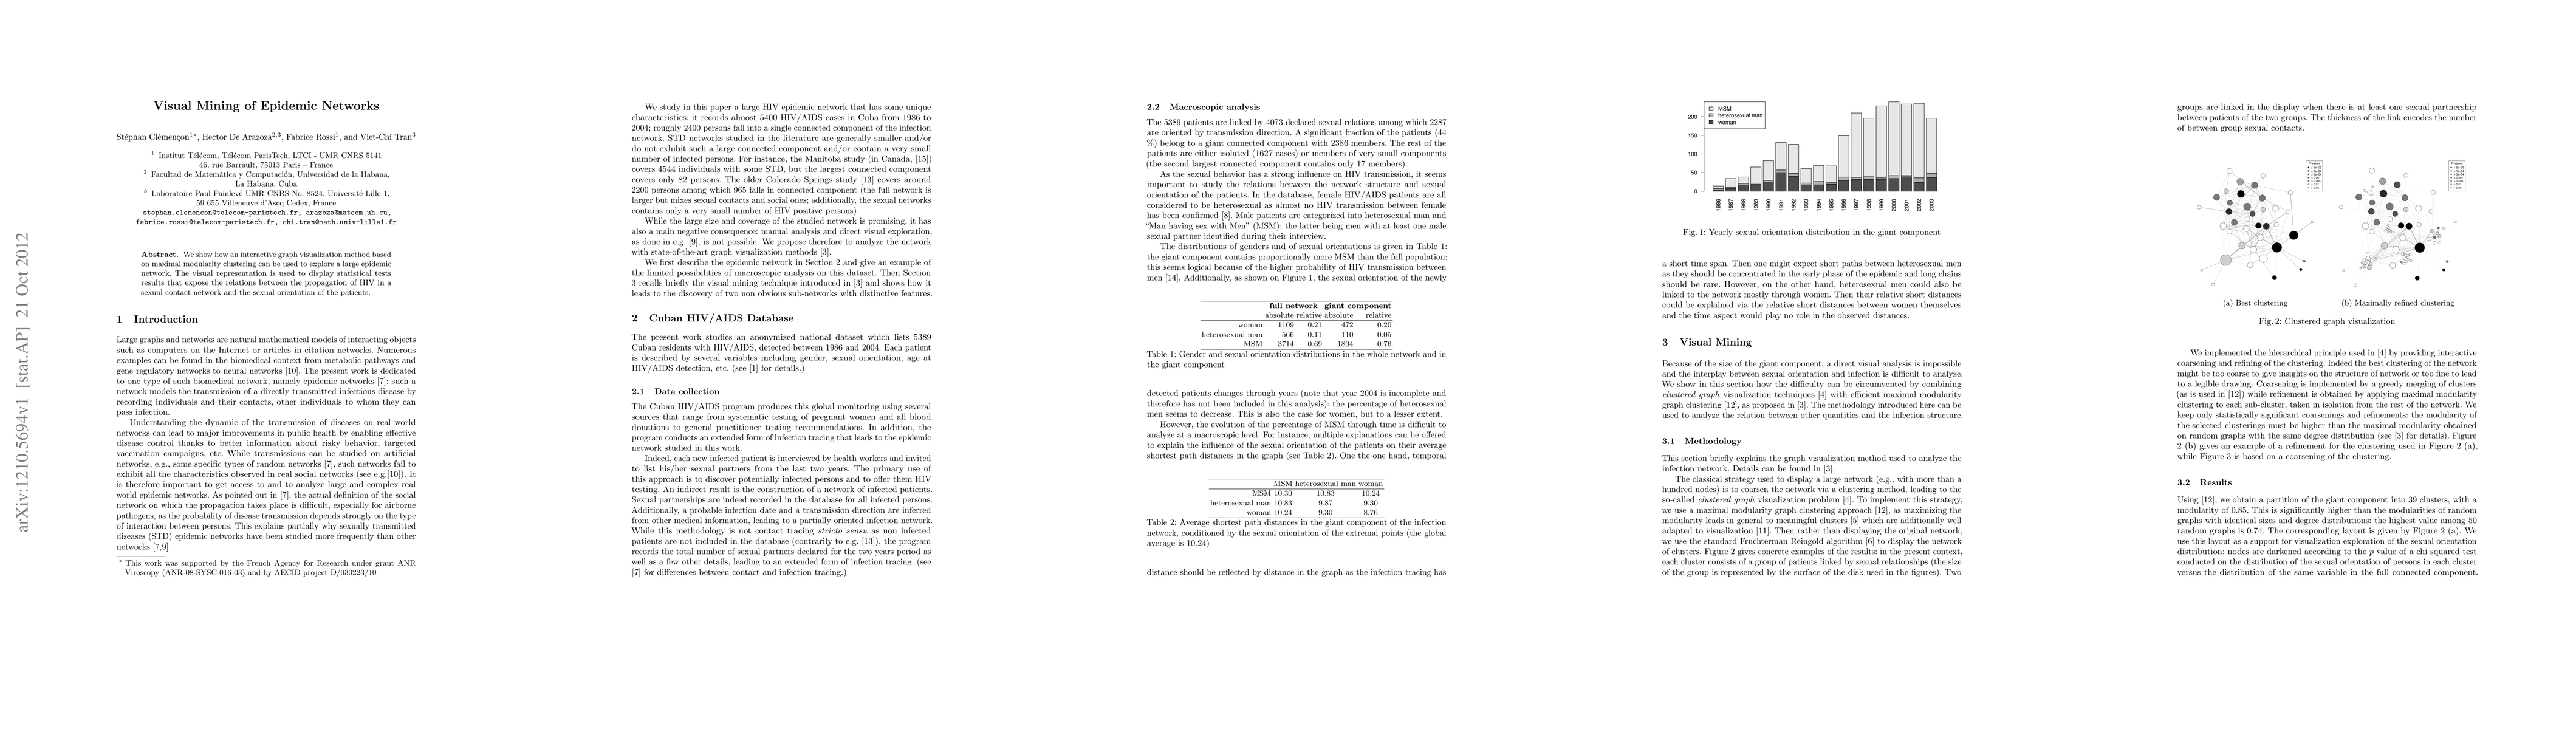
We show how an interactive graph visualization method based on maximal modularity clustering can be used to explore a large epidemic network. The visual representation is used to display statistical tests results that expose the relations between the propagation of HIV in a sexual contact network and the sexual orientation of the patients.
AI Key Findings
Get AI-generated insights about this paper's methodology, results, significance, and more — seven facets brought into focus.
Impact
10
Citations
16
References
Paper Details
Paper ID:
1210.5694
Journal:
International Work Conference on Artificial Neural Networks,
Torremolinos : Spain (2011)
License:
http://arxiv.org/licenses/nonexclusive-distrib/1.0/
Comments:
8 pages
Categories:
stat.AP
cs.SI
physics.soc-ph
PDF Preview
Key Terms
epidemic
(0.288)
interactive
(0.272)
patients
(0.253)
network
(0.249)
display
(0.247)
orientation
(0.240)
method based
(0.236)
contact
(0.230)
Citation Network
Current paper (gray), citations (green), references (blue)
Display is limited for performance on very large graphs.
Current Paper
Citations
References
Click to view
Discussion 0