Visual Reasoning of Feature Attribution with Deep Recurrent Neural Networks
Publication
Metrics
AI Quick Summary
This paper introduces a visual analytics method to help data scientists understand the feature attributions in Deep Recurrent Neural Networks (RNNs) by visualizing RNN attention, temporal positions, and variable contributions. The approach aids in comprehending the dynamics of RNNs during training, thereby informing and improving the modeling process.
Paper Preview
Abstract
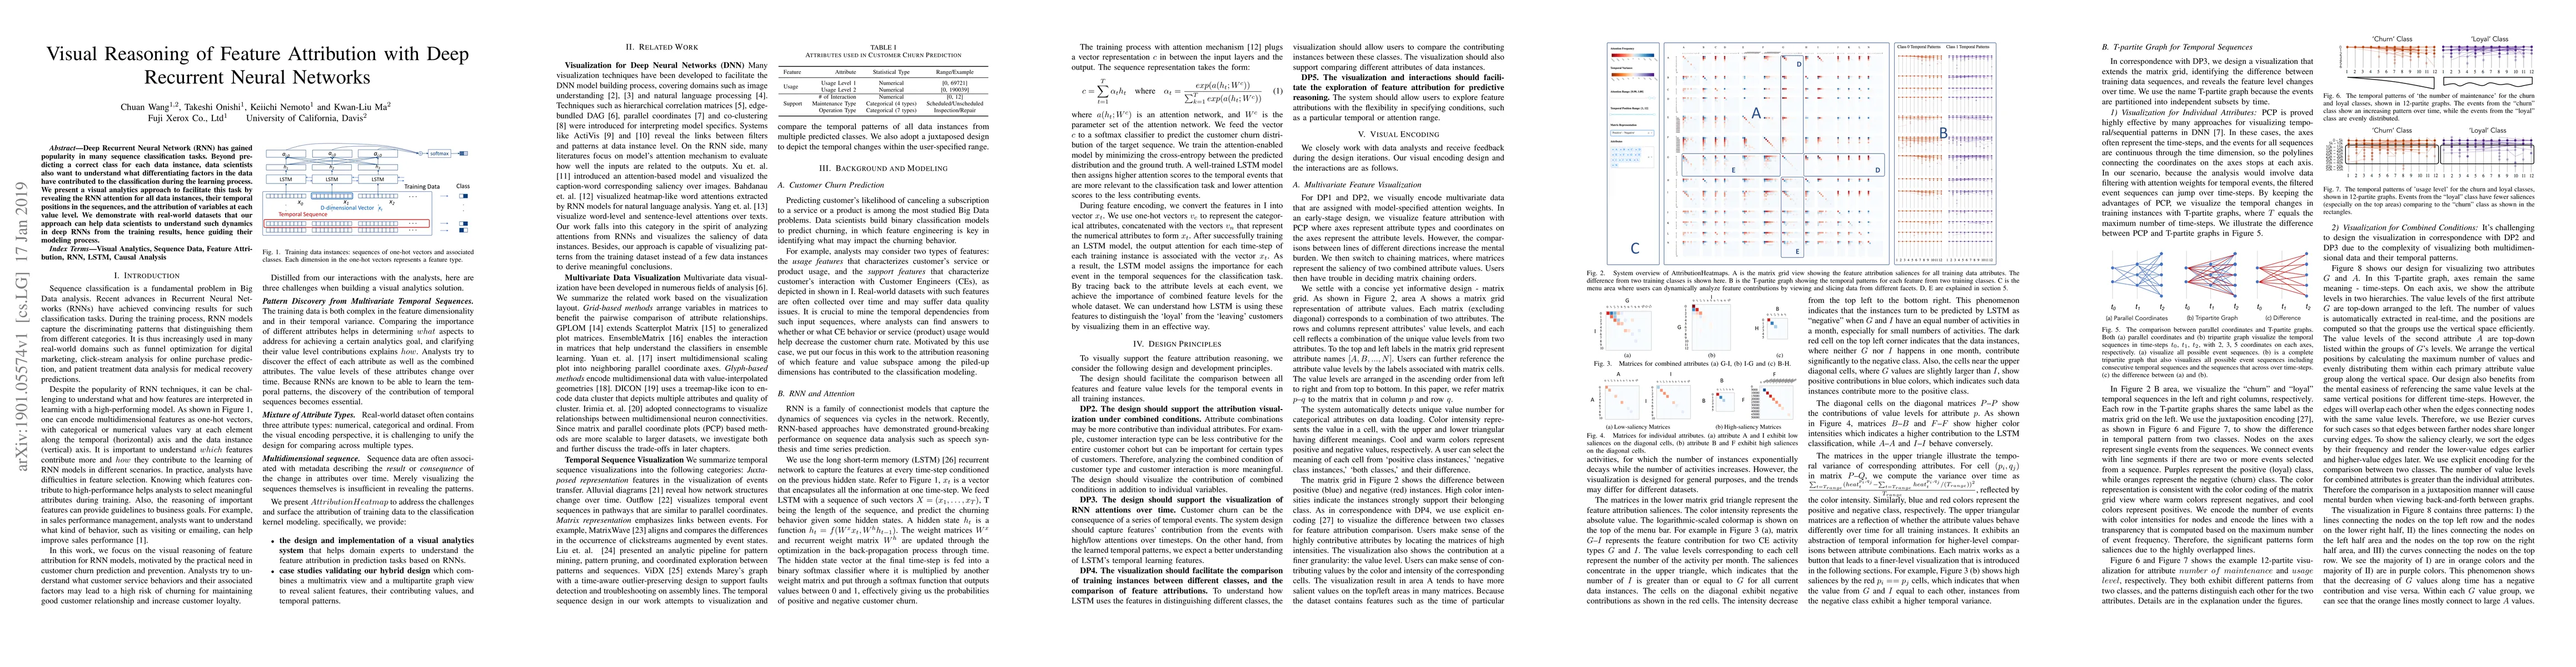
Deep Recurrent Neural Network (RNN) has gained popularity in many sequence classification tasks. Beyond predicting a correct class for each data instance, data scientists also want to understand what differentiating factors in the data have contributed to the classification during the learning process. We present a visual analytics approach to facilitate this task by revealing the RNN attention for all data instances, their temporal positions in the sequences, and the attribution of variables at each value level. We demonstrate with real-world datasets that our approach can help data scientists to understand such dynamics in deep RNNs from the training results, hence guiding their modeling process.
AI Key Findings
Get AI-generated insights about this paper's methodology, results, significance, and more — seven facets brought into focus.
Impact
Paper Details
PDF Preview
Key Terms
Citation Network
Current paper (gray), citations (green), references (blue)
Display is limited for performance on very large graphs.
Discussion 0