Publication
Metrics
AI Quick Summary
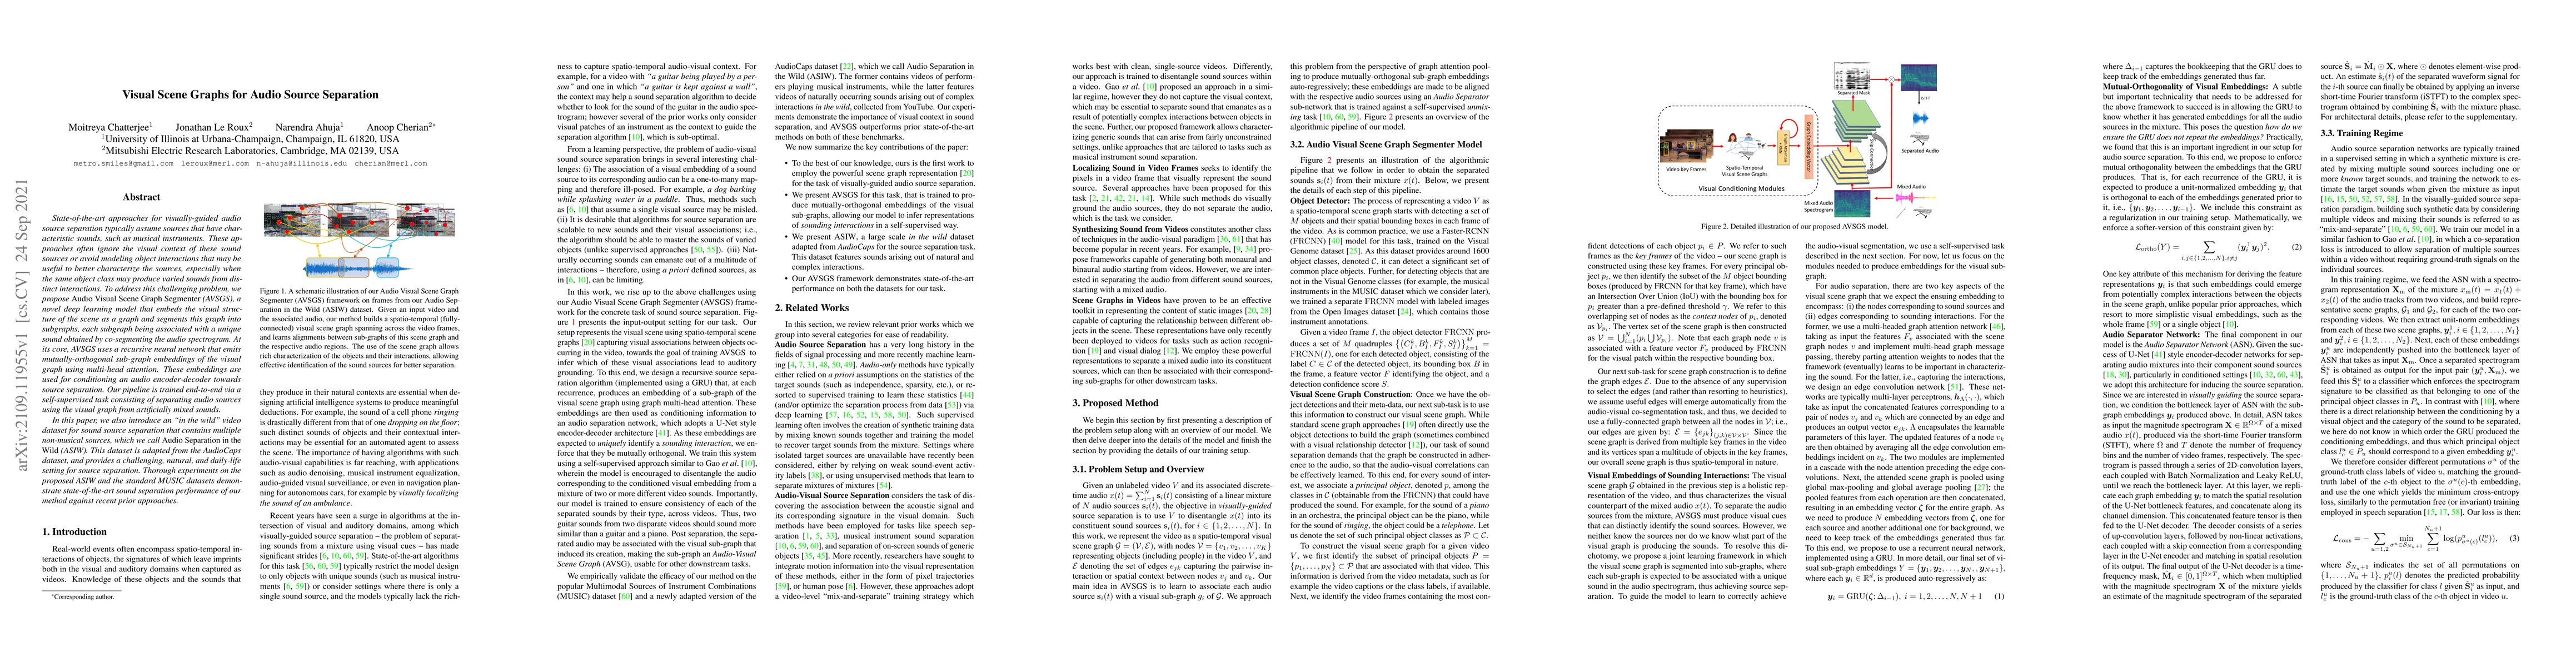
The paper proposes AVSGS, a deep learning model that uses visual scene graphs to improve audio source separation by embedding visual context and modeling object interactions. The method achieves state-of-the-art performance on both a new "in the wild" dataset, ASIW, and a standard MUSIC dataset.
Paper Preview
Abstract
State-of-the-art approaches for visually-guided audio source separation typically assume sources that have characteristic sounds, such as musical instruments. These approaches often ignore the visual context of these sound sources or avoid modeling object interactions that may be useful to better characterize the sources, especially when the same object class may produce varied sounds from distinct interactions. To address this challenging problem, we propose Audio Visual Scene Graph Segmenter (AVSGS), a novel deep learning model that embeds the visual structure of the scene as a graph and segments this graph into subgraphs, each subgraph being associated with a unique sound obtained by co-segmenting the audio spectrogram. At its core, AVSGS uses a recursive neural network that emits mutually-orthogonal sub-graph embeddings of the visual graph using multi-head attention. These embeddings are used for conditioning an audio encoder-decoder towards source separation. Our pipeline is trained end-to-end via a self-supervised task consisting of separating audio sources using the visual graph from artificially mixed sounds. In this paper, we also introduce an "in the wild'' video dataset for sound source separation that contains multiple non-musical sources, which we call Audio Separation in the Wild (ASIW). This dataset is adapted from the AudioCaps dataset, and provides a challenging, natural, and daily-life setting for source separation. Thorough experiments on the proposed ASIW and the standard MUSIC datasets demonstrate state-of-the-art sound separation performance of our method against recent prior approaches.
AI Key Findings
Get AI-generated insights about this paper's methodology, results, significance, and more — seven facets brought into focus.
Impact
Paper Details
Authors
PDF Preview
Key Terms
Citation Network
Current paper (gray), citations (green), references (blue)
Display is limited for performance on very large graphs.
Discussion 0