Summary
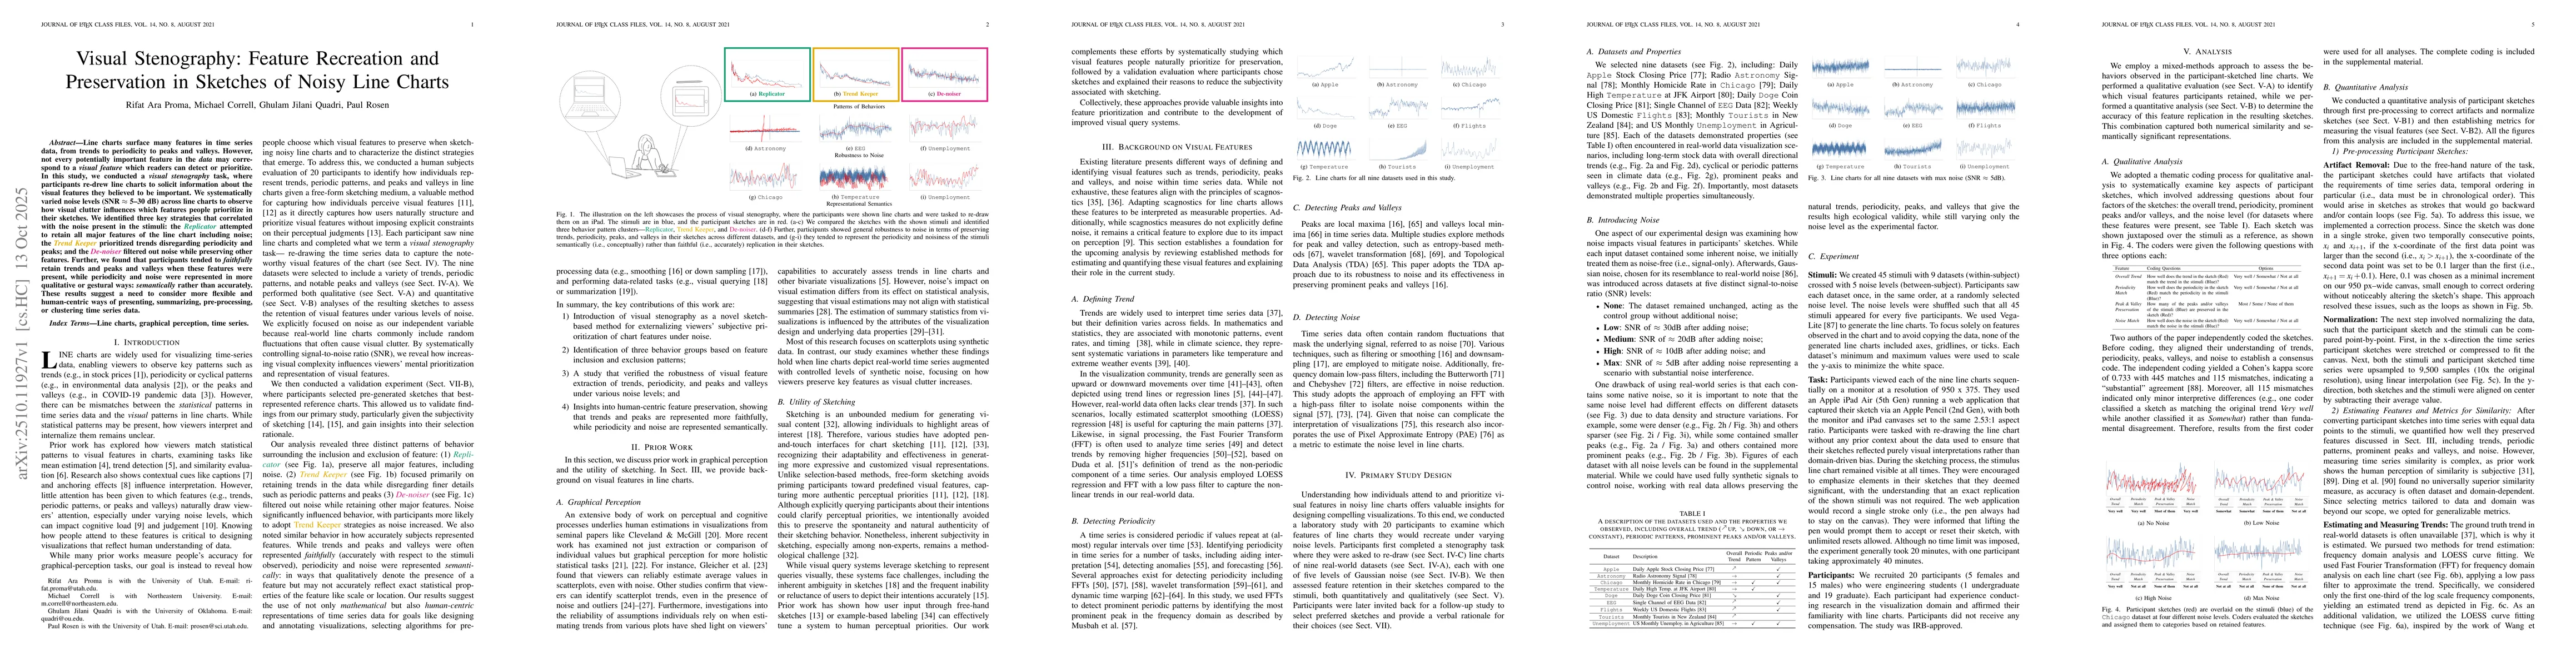
Line charts surface many features in time series data, from trends to periodicity to peaks and valleys. However, not every potentially important feature in the data may correspond to a visual feature which readers can detect or prioritize. In this study, we conducted a visual stenography task, where participants re-drew line charts to solicit information about the visual features they believed to be important. We systematically varied noise levels (SNR ~5-30 dB) across line charts to observe how visual clutter influences which features people prioritize in their sketches. We identified three key strategies that correlated with the noise present in the stimuli: the Replicator attempted to retain all major features of the line chart including noise; the Trend Keeper prioritized trends disregarding periodicity and peaks; and the De-noiser filtered out noise while preserving other features. Further, we found that participants tended to faithfully retain trends and peaks and valleys when these features were present, while periodicity and noise were represented in more qualitative or gestural ways: semantically rather than accurately. These results suggest a need to consider more flexible and human-centric ways of presenting, summarizing, pre-processing, or clustering time series data.
AI Key Findings
Generated Oct 31, 2025
Methodology
The study combined qualitative and quantitative analysis of user-generated sketches of line charts, assessing how participants represented different visual features under varying noise conditions.
Key Results
- Participants prioritized trends, peaks, and valleys over periodicity and noise in their representations
- Users demonstrated resilience in preserving underlying data patterns despite increasing noise levels
- Semantic and conceptual representation of periodicity and noise was common, while trends were more faithfully depicted
Significance
This research provides critical insights for designing more effective line charts that align with human perceptual priorities, improving data communication and visualization practices.
Technical Contribution
Development of a framework for evaluating how users perceive and represent different visual features in line charts through sketch-based analysis
Novelty
Introduces a sketch-based methodology for understanding human perception of line chart features, combining both qualitative coding and quantitative analysis of visual representations
Limitations
- Single-stroke sketching may have restricted participants' ability to accurately depict complex visual features
- Small sketch set size potentially limited representational breadth and generalizability of findings
Future Work
- Exploring multi-stroke sketching for greater representational flexibility
- Investigating the impact of different similarity metrics on feature fidelity assessment
- Examining how domain knowledge influences visual feature representation strategies
Paper Details
PDF Preview
Similar Papers
Found 5 papersWhat Is the Difference Between a Mountain and a Molehill? Quantifying Semantic Labeling of Visual Features in Line Charts
Vidya Setlur, Dennis Bromley
Handwritten Stenography Recognition and the LION Dataset
Raphaela Heil, Malin Nauwerck
Comments (0)