Visual Storytelling: A Methodological Approach to Designing and Implementing a Visualisation Poster
Publication
Metrics
AI Quick Summary
This study proposes a methodological approach for designing effective visualisation posters, emphasizing clear focus, envisioned use, and essential concepts. It uses the Five Design-Sheet method to guide the processes of data comprehension, design planning, and iterative refinement of the visualisation.
Paper Preview
Abstract
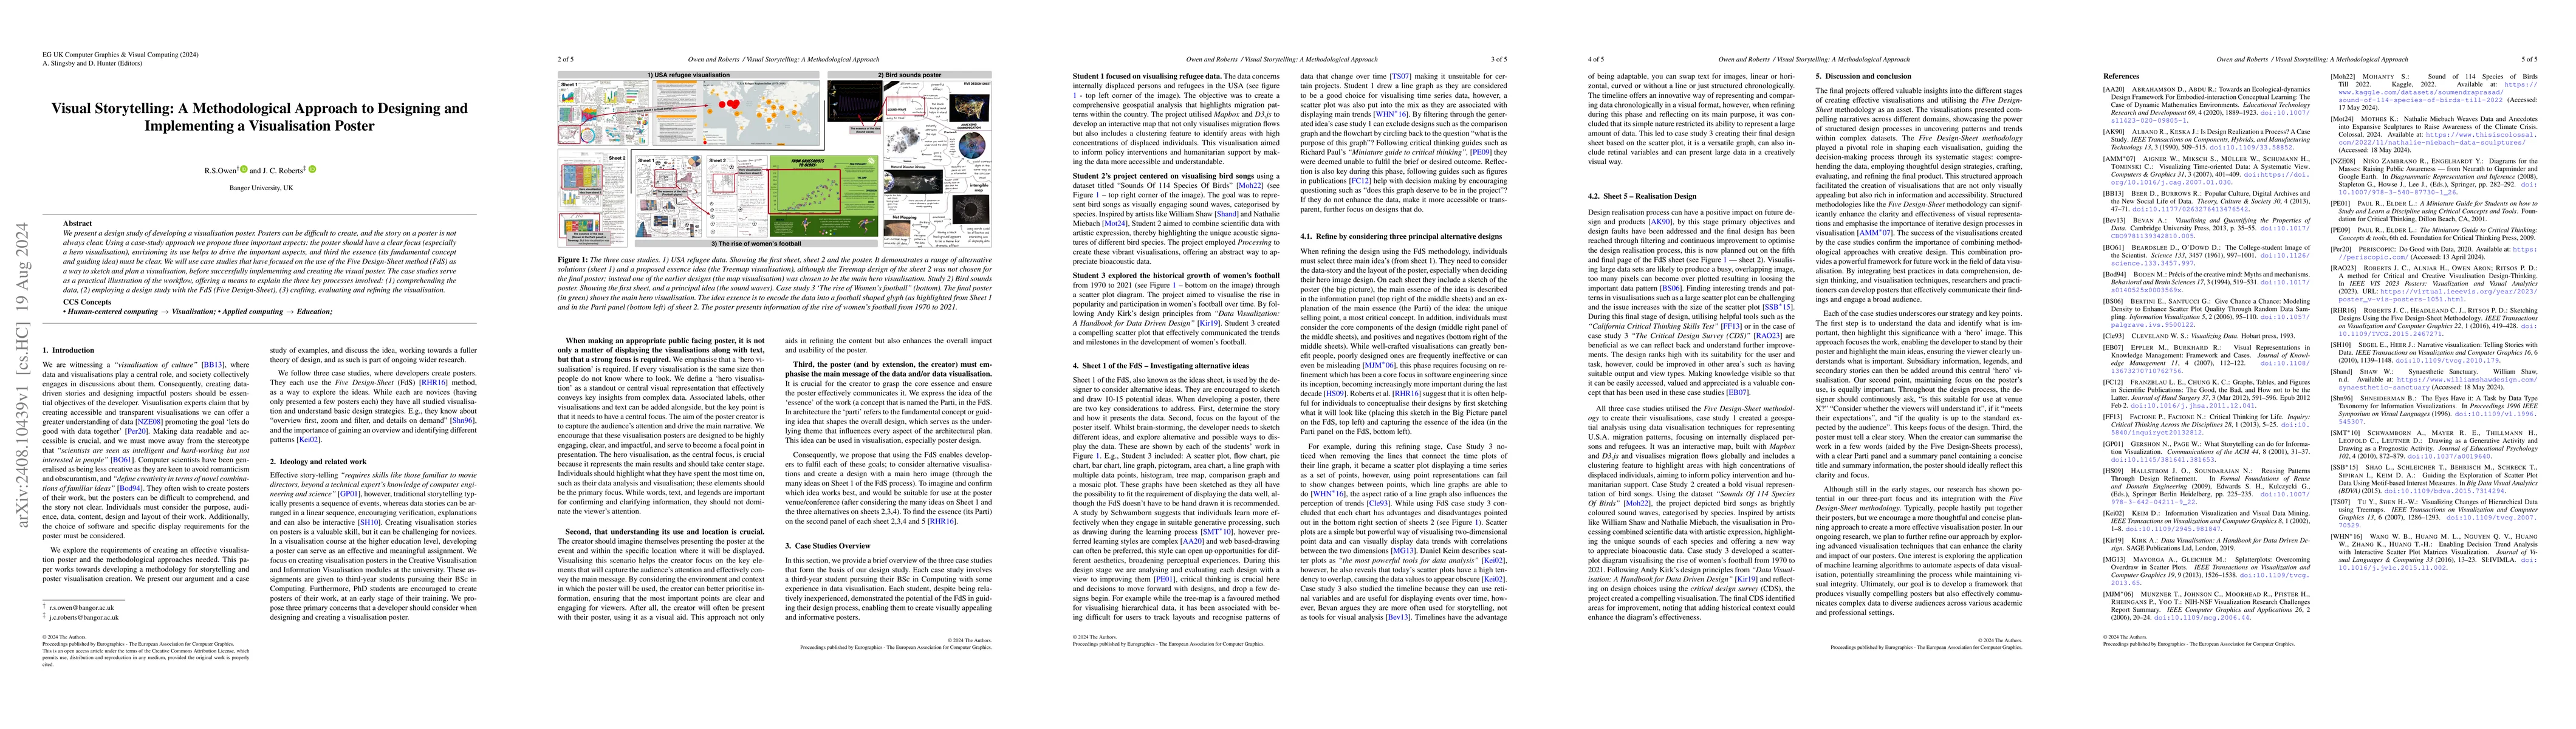
We present a design study of developing a visualisation poster. Posters can be difficult to create, and the story on a poster is not always clear. Using a case-study approach we propose three important aspects: the poster should have a clear focus (especially a hero visualisation), envisioning its use helps to drive the important aspects, and third the essence (its fundamental concept and guiding idea) must be clear. We will use case studies that have focused on the use of the Five Design-Sheet method (FdS) as a way to sketch and plan a visualisation, before successfully implementing and creating the visual poster. The case studies serve as a practical illustration of the workflow, offering a means to explain the three key processes involved: (1) comprehending the data, (2) employing a design study with the FdS (Five Design-Sheet), (3) crafting, evaluating and refining the visualisation.
AI Key Findings
Get AI-generated insights about this paper's methodology, results, significance, and more — seven facets brought into focus.
Impact
Paper Details
Authors
PDF Preview
Citation Network
Current paper (gray), citations (green), references (blue)
Display is limited for performance on very large graphs.
Discussion 0