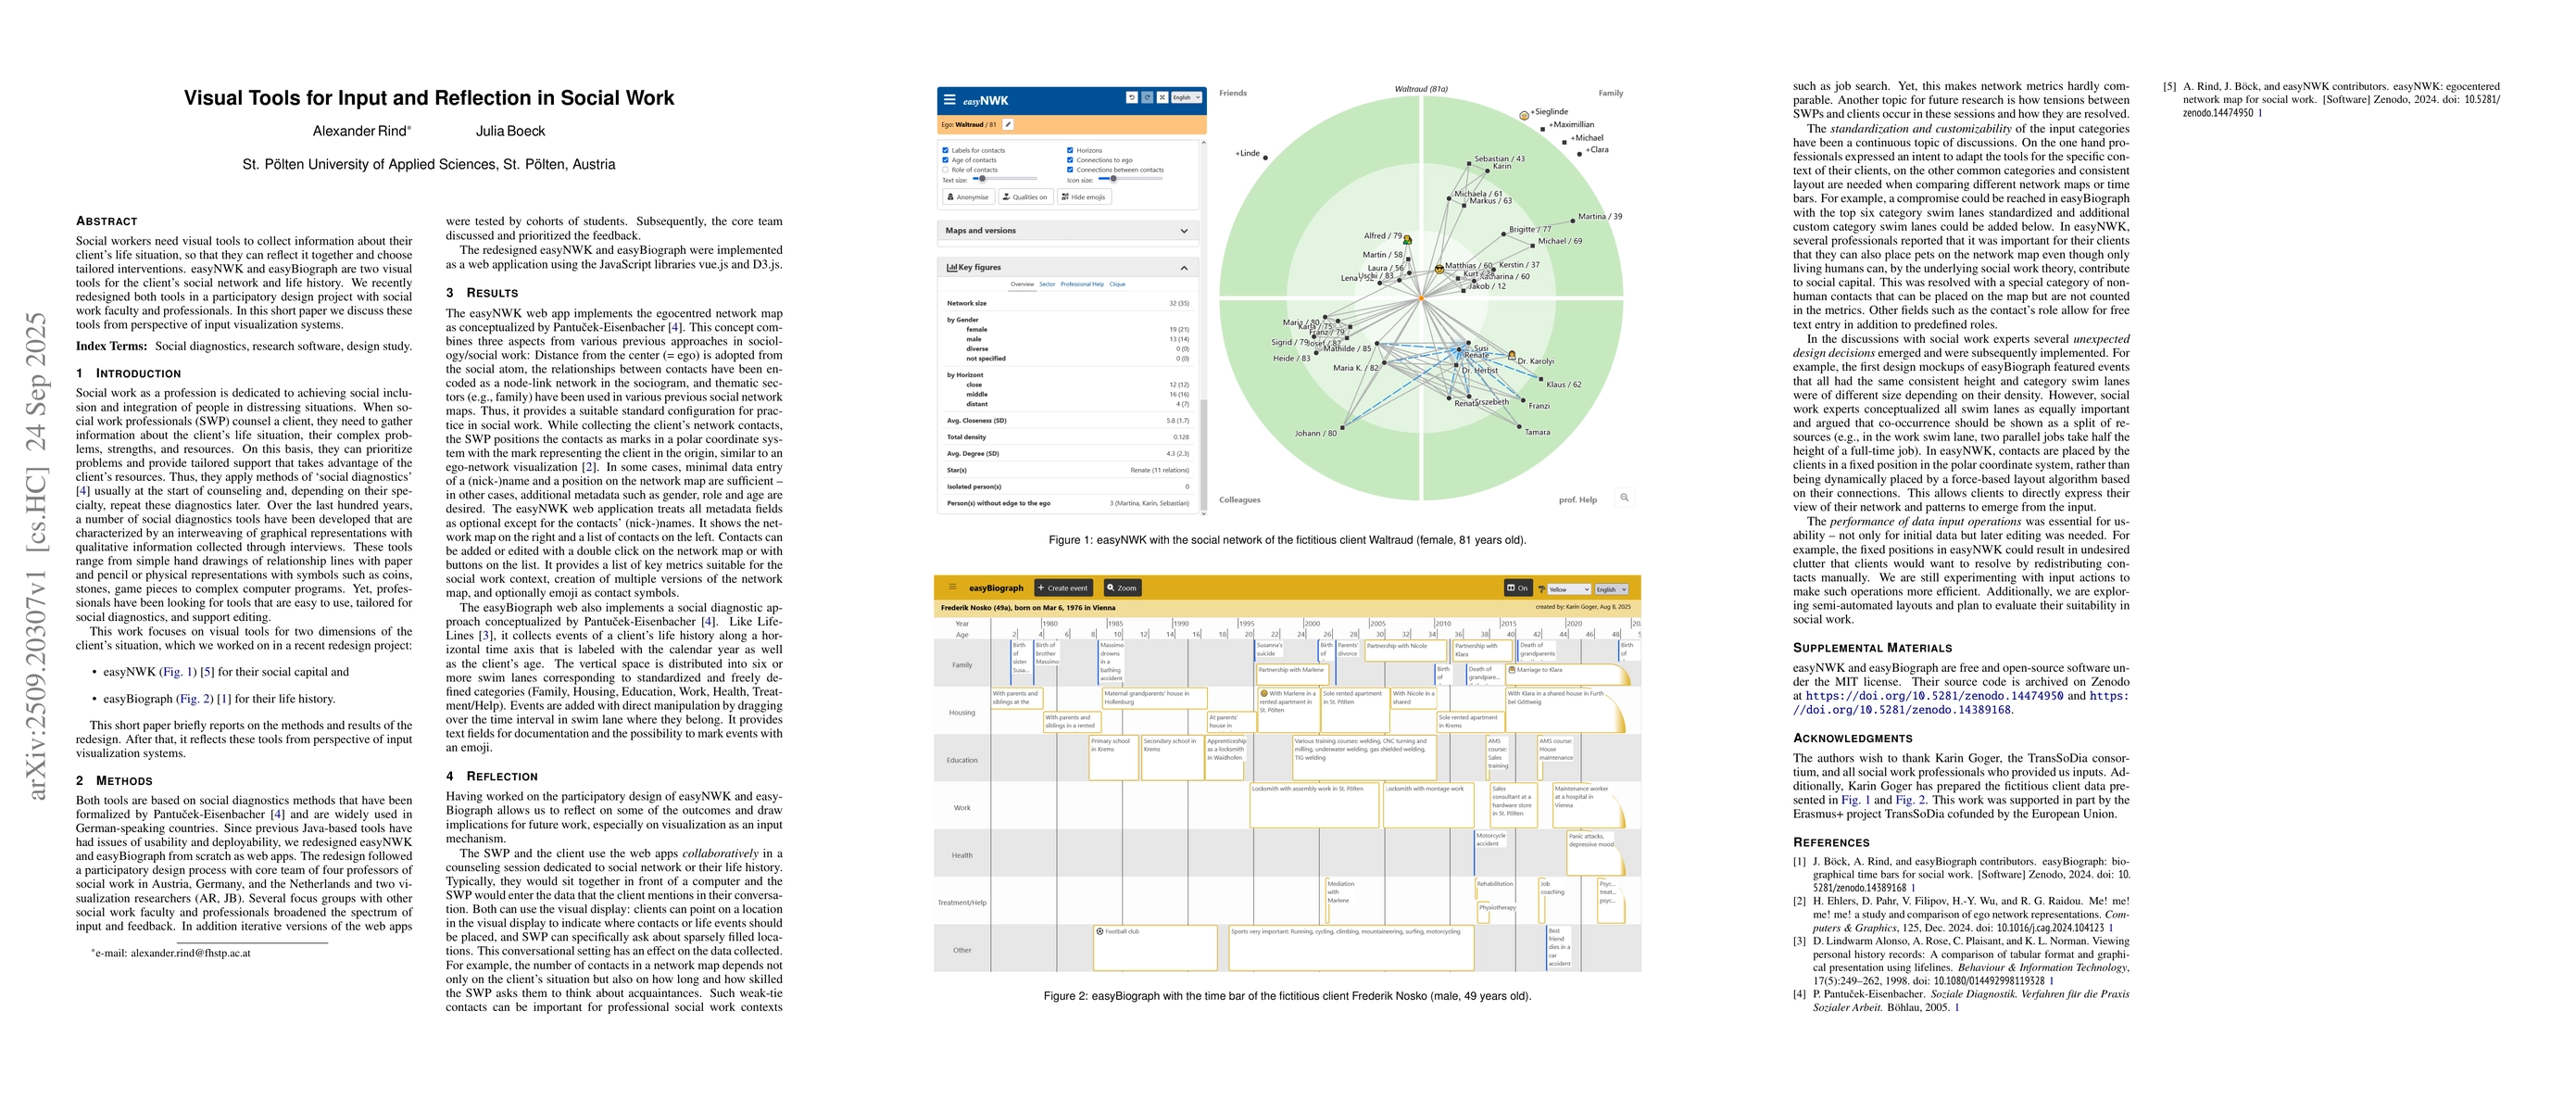
The study employed a participatory design approach, involving social work professionals and researchers to co-develop and refine the visual tools easyNWK and easyBiograph. Iterative testing with students and professionals was conducted to gather feedback and improve usability.
Publication
Metrics
Quick Answers
What methodology did the authors use?
The study employed a participatory design approach, involving social work professionals and researchers to co-develop and refine the visual tools easyNWK and easyBiograph. Iterative testing with students and professionals was conducted to gather feedback and improve usability. More in Methodology →
What are the key results?
easyNWK and easyBiograph were redesigned as web applications using JavaScript libraries (vue.js and D3.js) to enhance usability and deployment. — The tools support collaborative data collection between social workers and clients, enabling visual reflection on social networks and life history. More in Key Results →
Why is this work significant?
These tools provide social workers with effective means to gather and visualize client data, facilitating tailored interventions and improving social diagnostics in practice. More in Significance →
What are the main limitations?
Network metrics may lack comparability due to variations in how social workers ask clients to reflect on contacts. — The fixed positioning of contacts in easyNWK can lead to visual clutter that clients may need to manually resolve. More in Limitations →
Abstract
Social workers need visual tools to collect information about their client's life situation, so that they can reflect it together and choose tailored interventions. easyNWK and easyBiograph are two visual tools for the client's social network and life history. We recently redesigned both tools in a participatory design project with social work faculty and professionals. In this short paper we discuss these tools from perspective of input visualization systems.
Key Findings, in focus
Seven facets of this paper, analysed and brought into focus by AI.
These tools provide social workers with effective means to gather and visualize client data, facilitating tailored interventions and improving social diagnostics in practice.
- easyNWK and easyBiograph were redesigned as web applications using JavaScript libraries (vue.js and D3.js) to enhance usability and deployment.
- The tools support collaborative data collection between social workers and clients, enabling visual reflection on social networks and life history.
- The design allows clients to directly express their network perceptions, with patterns emerging from their input rather than algorithmic placement.
These tools provide social workers with effective means to gather and visualize client data, facilitating tailored interventions and improving social diagnostics in practice.
The development of easyNWK and easyBiograph as web-based applications with customizable and standardized input categories, leveraging visualization libraries for interactive data representation.
The integration of participatory design with social work practice, combined with the use of web technologies to create flexible and collaborative visual tools for social diagnostics.
- Network metrics may lack comparability due to variations in how social workers ask clients to reflect on contacts.
- The fixed positioning of contacts in easyNWK can lead to visual clutter that clients may need to manually resolve.
- Exploring semi-automated layouts to improve data input efficiency in social work contexts.
- Investigating tensions between social workers and clients during data collection sessions and how they are resolved.
- Standardizing input categories while maintaining customization for different professional contexts.
Discussion 0