Visualisation to Explain Personal Health Trends in Smart Homes
Publication
Metrics
AI Quick Summary
This paper explores using ambient sensor networks in smart homes to monitor residents' daily activities and compares them to typical and risky profiles to recommend interventions. To enhance trust in the system, it proposes a visualisation workflow with clear, colour-coded graphs to make the decision-making process more transparent.
Paper Preview
Abstract
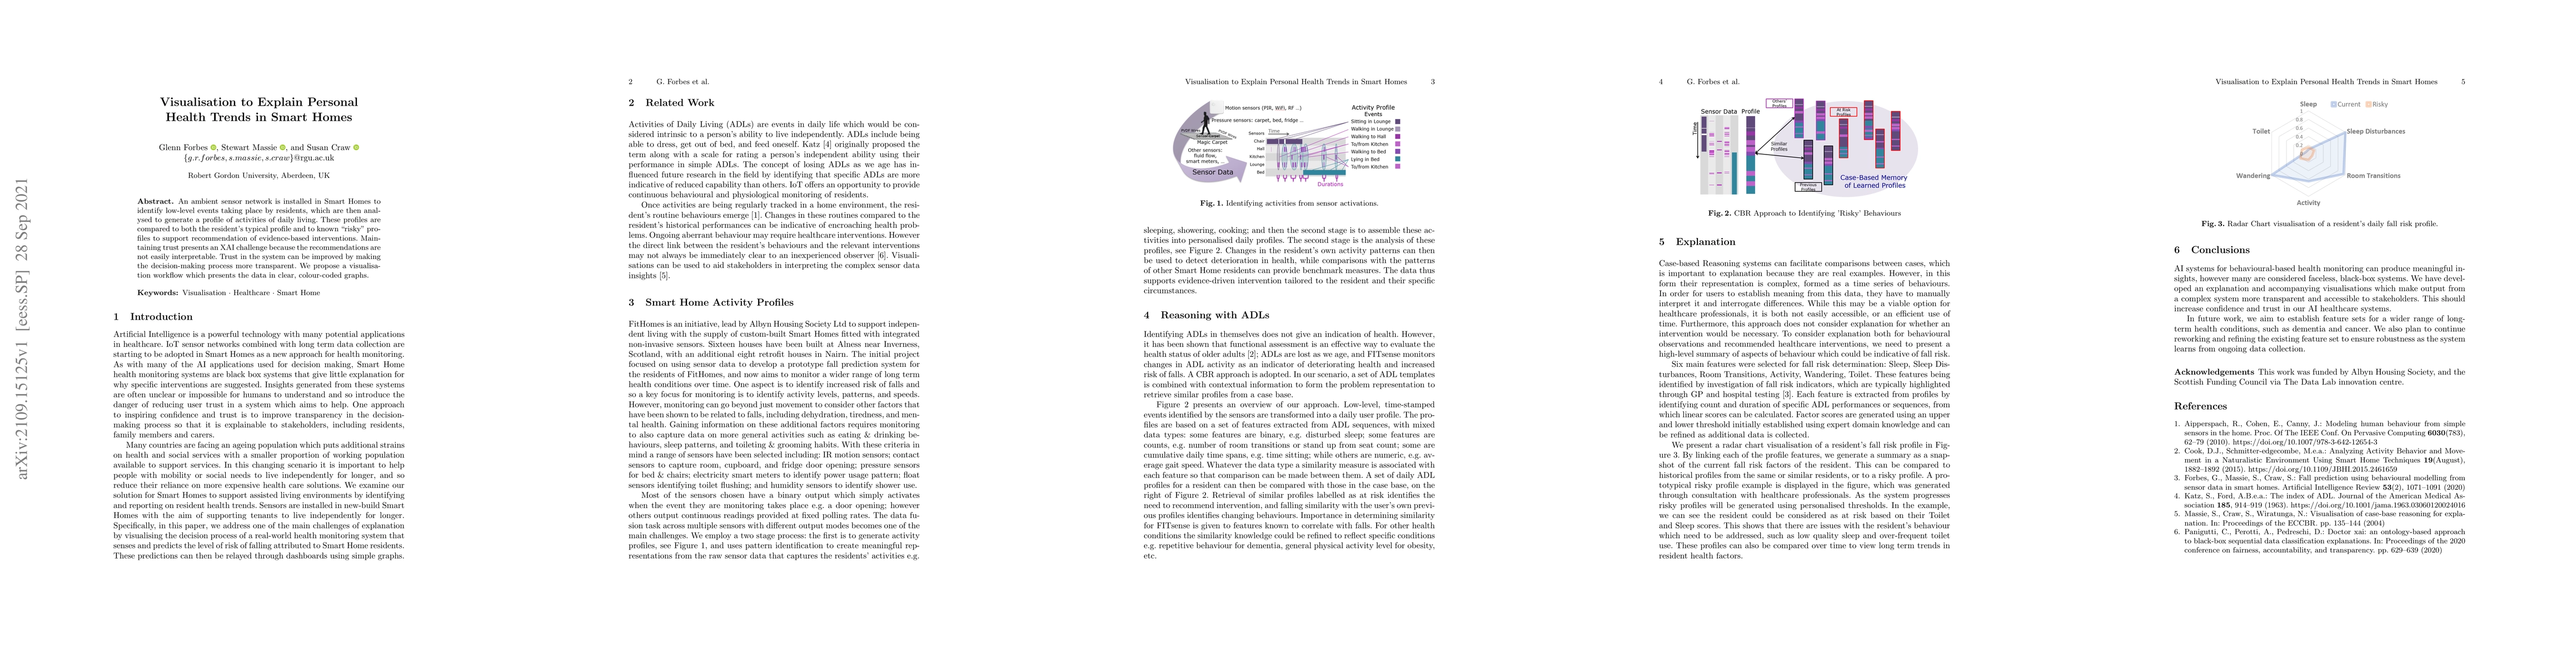
An ambient sensor network is installed in Smart Homes to identify low-level events taking place by residents, which are then analysed to generate a profile of activities of daily living. These profiles are compared to both the resident's typical profile and to known "risky" profiles to support recommendation of evidence-based interventions. Maintaining trust presents an XAI challenge because the recommendations are not easily interpretable. Trust in the system can be improved by making the decision-making process more transparent. We propose a visualisation workflow which presents the data in clear, colour-coded graphs.
AI Key Findings
Get AI-generated insights about this paper's methodology, results, significance, and more — seven facets brought into focus.
Impact
Paper Details
Authors
PDF Preview
Key Terms
Citation Network
Current paper (gray), citations (green), references (blue)
Display is limited for performance on very large graphs.
Discussion 0