Visualising category recoding and numeric redistributions
Publication
Metrics
AI Quick Summary
This paper introduces graphical representations for visualizing data transformations between related taxonomies, proposing a new task abstraction called cross-taxonomy transformation and a crossmap structure to facilitate the separation of category recoding and numeric redistribution decisions. The paper discusses the potential and challenges of using visualizations to audit and communicate these transformations.
Paper Preview
Abstract
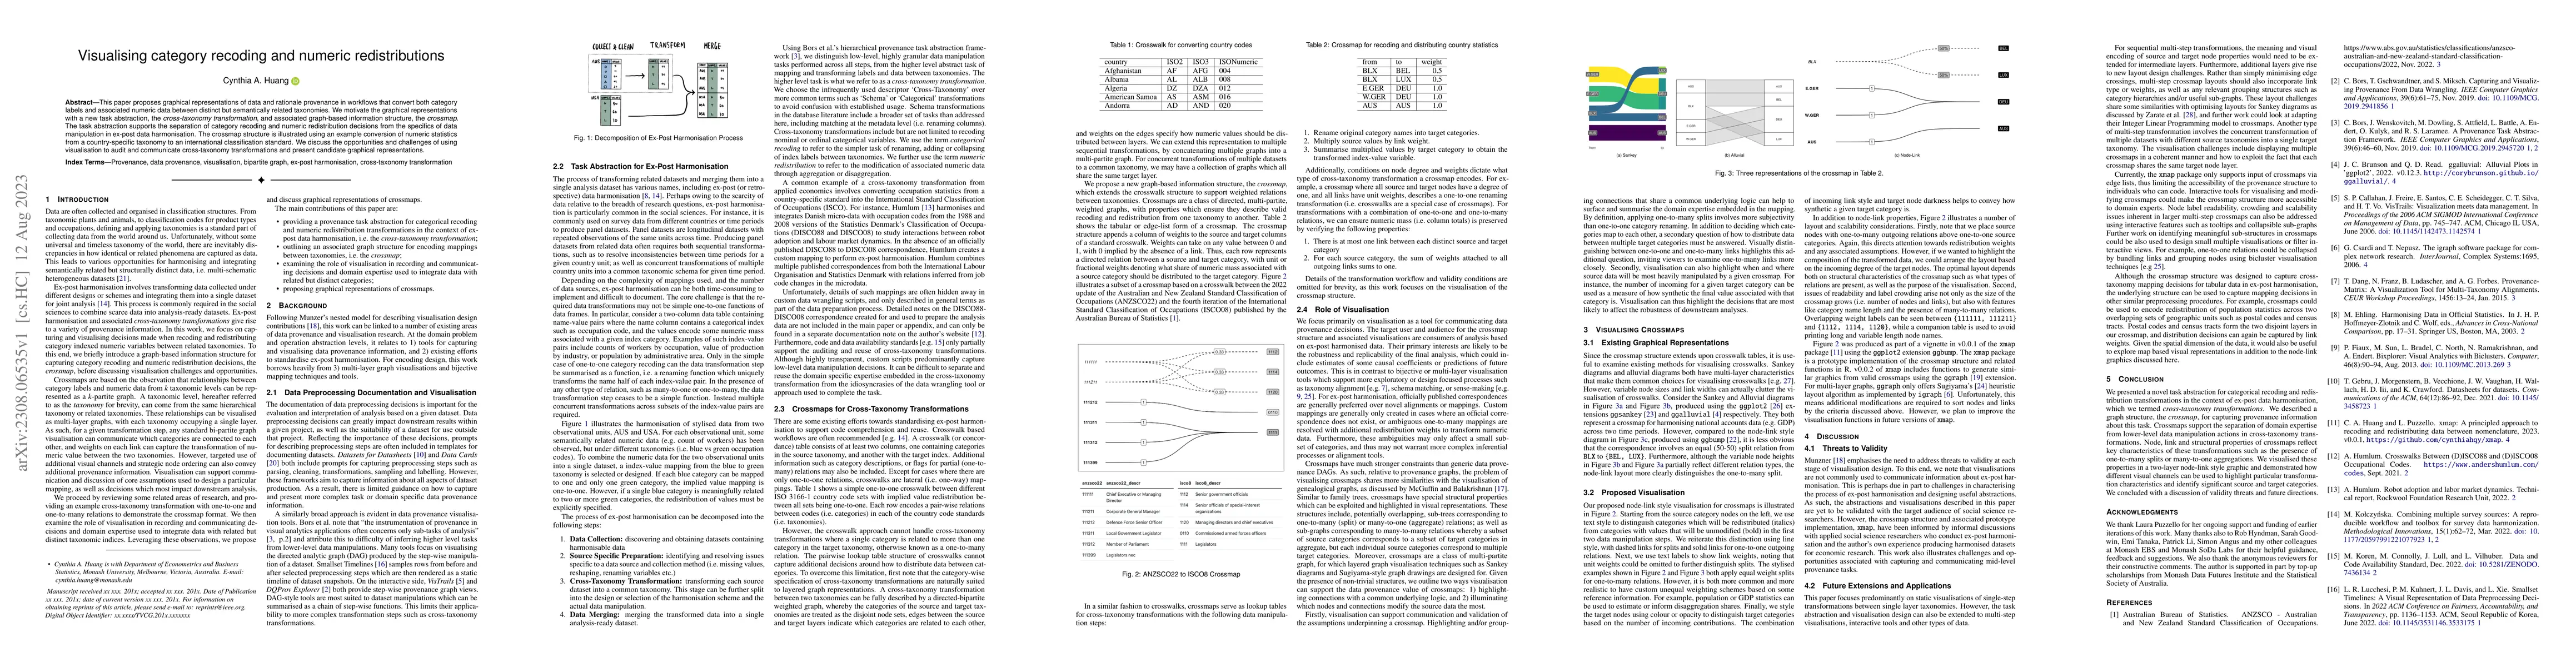
This paper proposes graphical representations of data and rationale provenance in workflows that convert both category labels and associated numeric data between distinct but semantically related taxonomies. We motivate the graphical representations with a new task abstraction, the cross-taxonomy transformation, and associated graph-based information structure, the crossmap. The task abstraction supports the separation of category recoding and numeric redistribution decisions from the specifics of data manipulation in ex-post data harmonisation. The crossmap structure is illustrated using an example conversion of numeric statistics from a country-specific taxonomy to an international classification standard. We discuss the opportunities and challenges of using visualisation to audit and communicate cross-taxonomy transformations and present candidate graphical representations.
AI Key Findings
Get AI-generated insights about this paper's methodology, results, significance, and more — seven facets brought into focus.
Impact
Paper Details
Authors
PDF Preview
Key Terms
Citation Network
Current paper (gray), citations (green), references (blue)
Display is limited for performance on very large graphs.
Discussion 0