Visualising the Evolution of English Covid-19 Cases with Topological Data Analysis Ball Mapper
Publication
Metrics
AI Quick Summary
Researchers used Topological Data Analysis Ball Mapper to visualize Covid-19 cases in England, revealing areas with rapid infection growth and others that remain unaffected, highlighting the importance of socio-economic dimensions in disease spread.
Paper Preview
Abstract
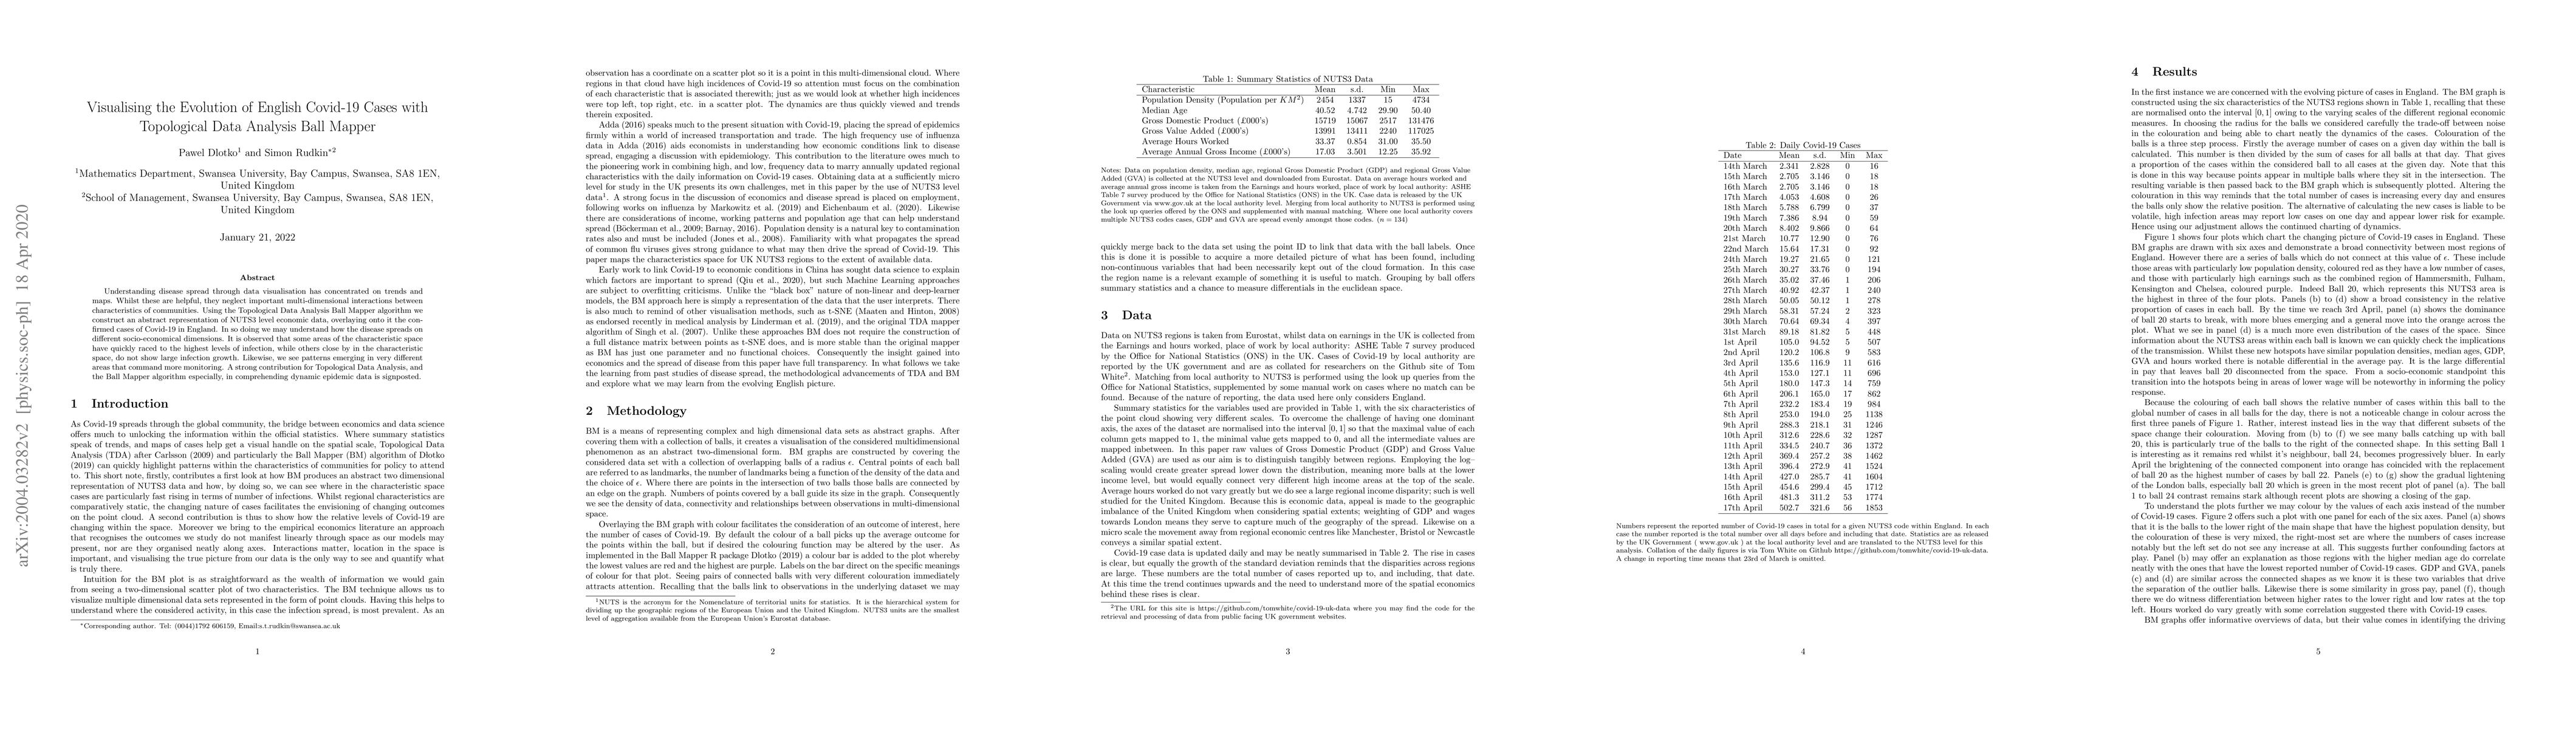
Understanding disease spread through data visualisation has concentrated on trends and maps. Whilst these are helpful, they neglect important multi-dimensional interactions between characteristics of communities. Using the Topological Data Analysis Ball Mapper algorithm we construct an abstract representation of NUTS3 level economic data, overlaying onto it the confirmed cases of Covid-19 in England. In so doing we may understand how the disease spreads on different socio-economical dimensions. It is observed that some areas of the characteristic space have quickly raced to the highest levels of infection, while others close by in the characteristic space, do not show large infection growth. Likewise, we see patterns emerging in very different areas that command more monitoring. A strong contribution for Topological Data Analysis, and the Ball Mapper algorithm especially, in comprehending dynamic epidemic data is signposted.
AI Key Findings
Get AI-generated insights about this paper's methodology, results, significance, and more — seven facets brought into focus.
Impact
Paper Details
PDF Preview
Key Terms
Citation Network
Current paper (gray), citations (green), references (blue)
Display is limited for performance on very large graphs.
Discussion 0