Visualization-Directed Interactive Model-Fitting to Spectral Data Cubes
Publication
Metrics
AI Quick Summary
This paper presents an interactive model-fitting tool using the S2PLOT library to visualize and analyze complex spectral data cubes, enabling better understanding of the 3D spatial configurations by comparing 3D models with velocity-space representations. The method employs 3D Cartesian shapelets for enhanced quantitative analysis.
Paper Preview
Abstract
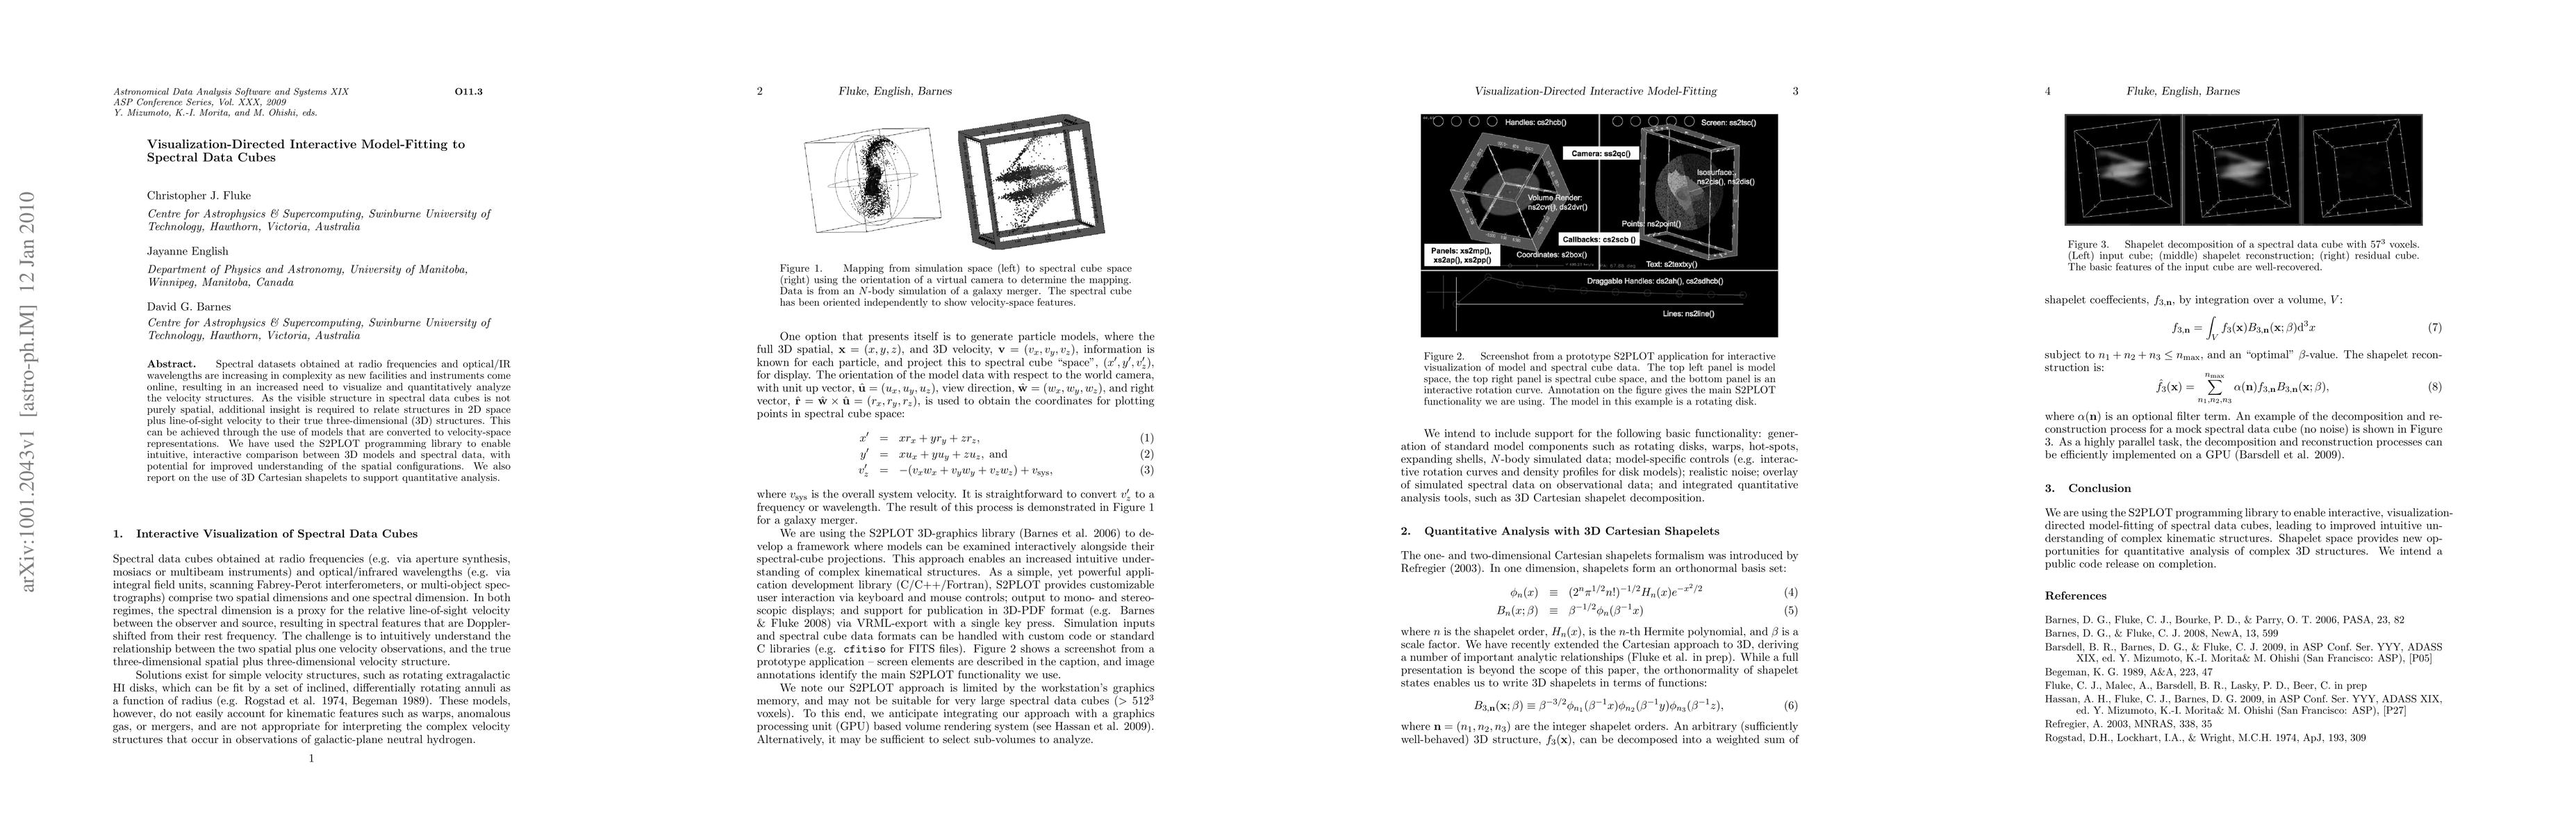
Spectral datasets obtained at radio frequencies and optical/IR wavelengths are increasing in complexity as new facilities and instruments come online, resulting in an increased need to visualize and quantitatively analyze the velocity structures. As the visible structure in spectral data cubes is not purely spatial, additional insight is required to relate structures in 2D space plus line-of-sight velocity to their true three-dimensional (3D) structures. This can be achieved through the use of models that are converted to velocity-space representations. We have used the S2PLOT programming library to enable intuitive, interactive comparison between 3D models and spectral data, with potential for improved understanding of the spatial configurations. We also report on the use of 3D Cartesian shapelets to support quantitative analysis.
AI Key Findings
Get AI-generated insights about this paper's methodology, results, significance, and more — seven facets brought into focus.
Paper Details
PDF Preview
Key Terms
Citation Network
Current paper (gray), citations (green), references (blue)
Display is limited for performance on very large graphs.
Related Papers
No references found for this paper.
Discussion 0