Visualization for Dichotomous Variables, the Independence and Markov chains
Publication
Metrics
AI Quick Summary
This paper explores the visualization of Markov chains with dichotomous variables, aiming to understand their independence relationships in a geometric way. It proposes new methods for visualizing these chains, allowing for easier understanding of conditional independence.
Paper Preview
Abstract
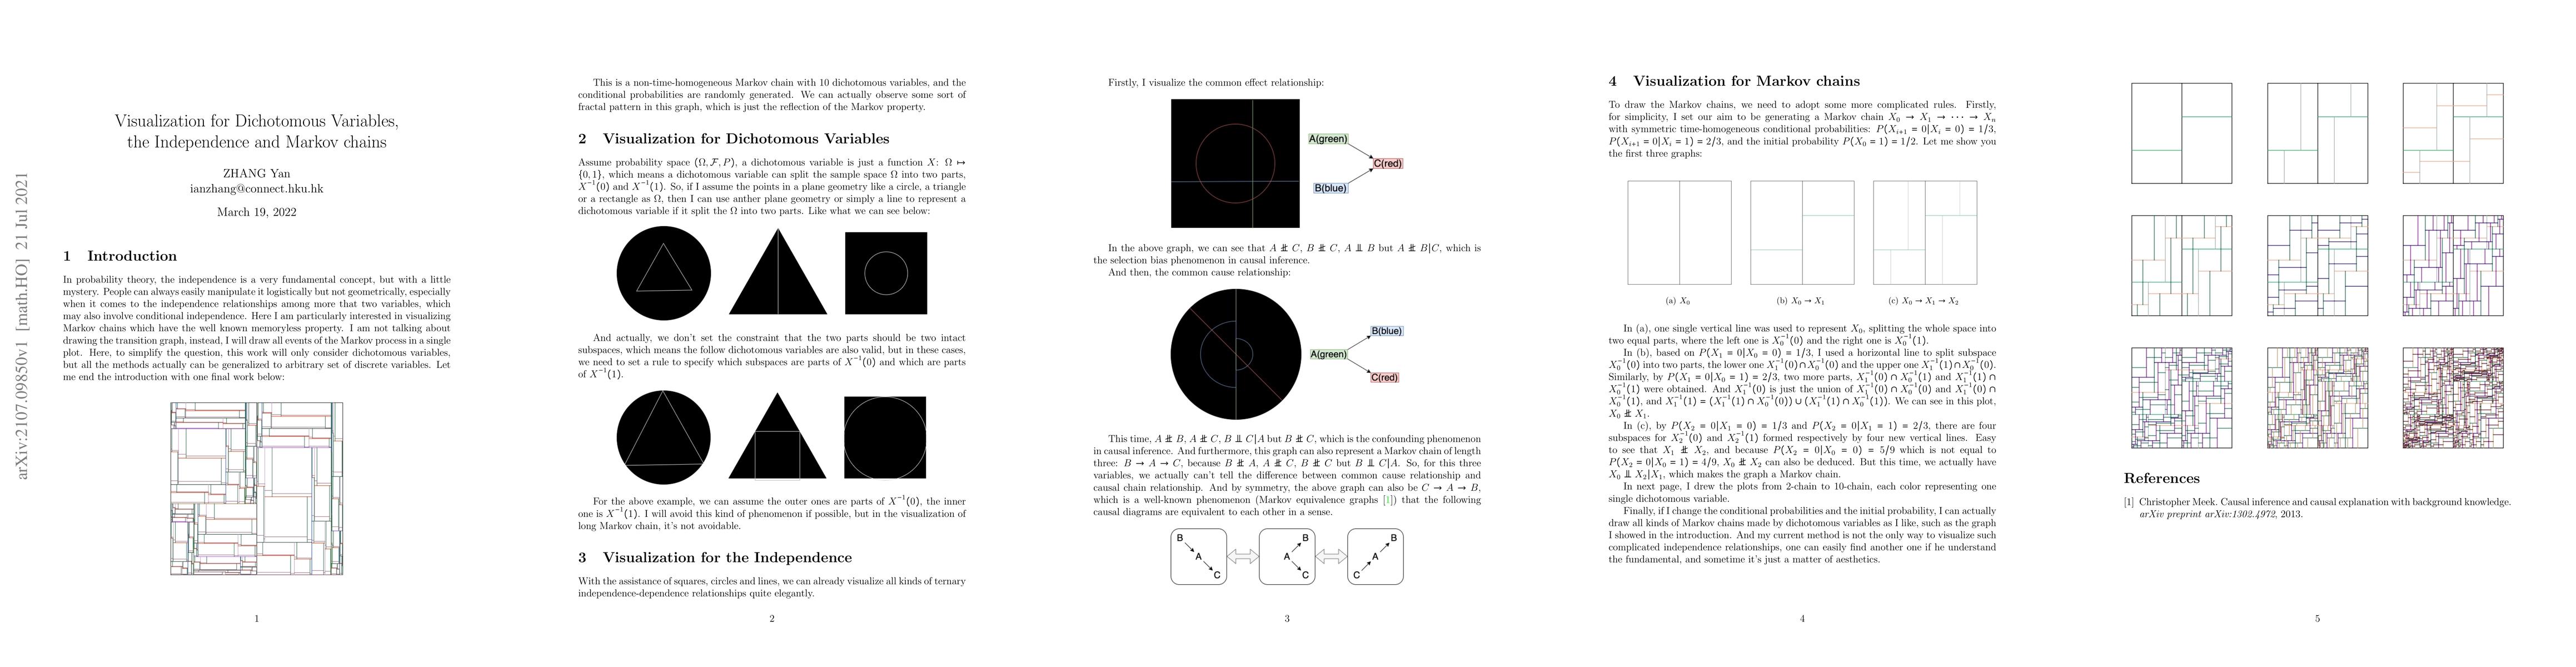
In probability theory, the independence is a very fundamental concept, but with a little mystery. People can always easily manipulate it logistically but not geometrically, especially when it comes to the independence relationships among more that two variables, which may also involve conditional independence. Here I am particularly interested in visualizing Markov chains which have the well known memoryless property. I am not talking about drawing the transition graph, instead, I will draw all events of the Markov process in a single plot. Here, to simplify the question, this work will only consider dichotomous variables, but all the methods actually can be generalized to arbitrary set of discrete variables.
AI Key Findings
Get AI-generated insights about this paper's methodology, results, significance, and more — seven facets brought into focus.
Discussion 0