Publication
Metrics
AI Quick Summary
This paper reviews the advancements in visualization techniques for enhancing trust and explainability in machine learning from 2020 to 2023, presenting 542 categorized techniques and identifying trends, insights, and eight key challenges in the field. The study confirms a growing reliance on visualization to improve model explainability and assess new deep learning architectures.
Paper Preview
Abstract
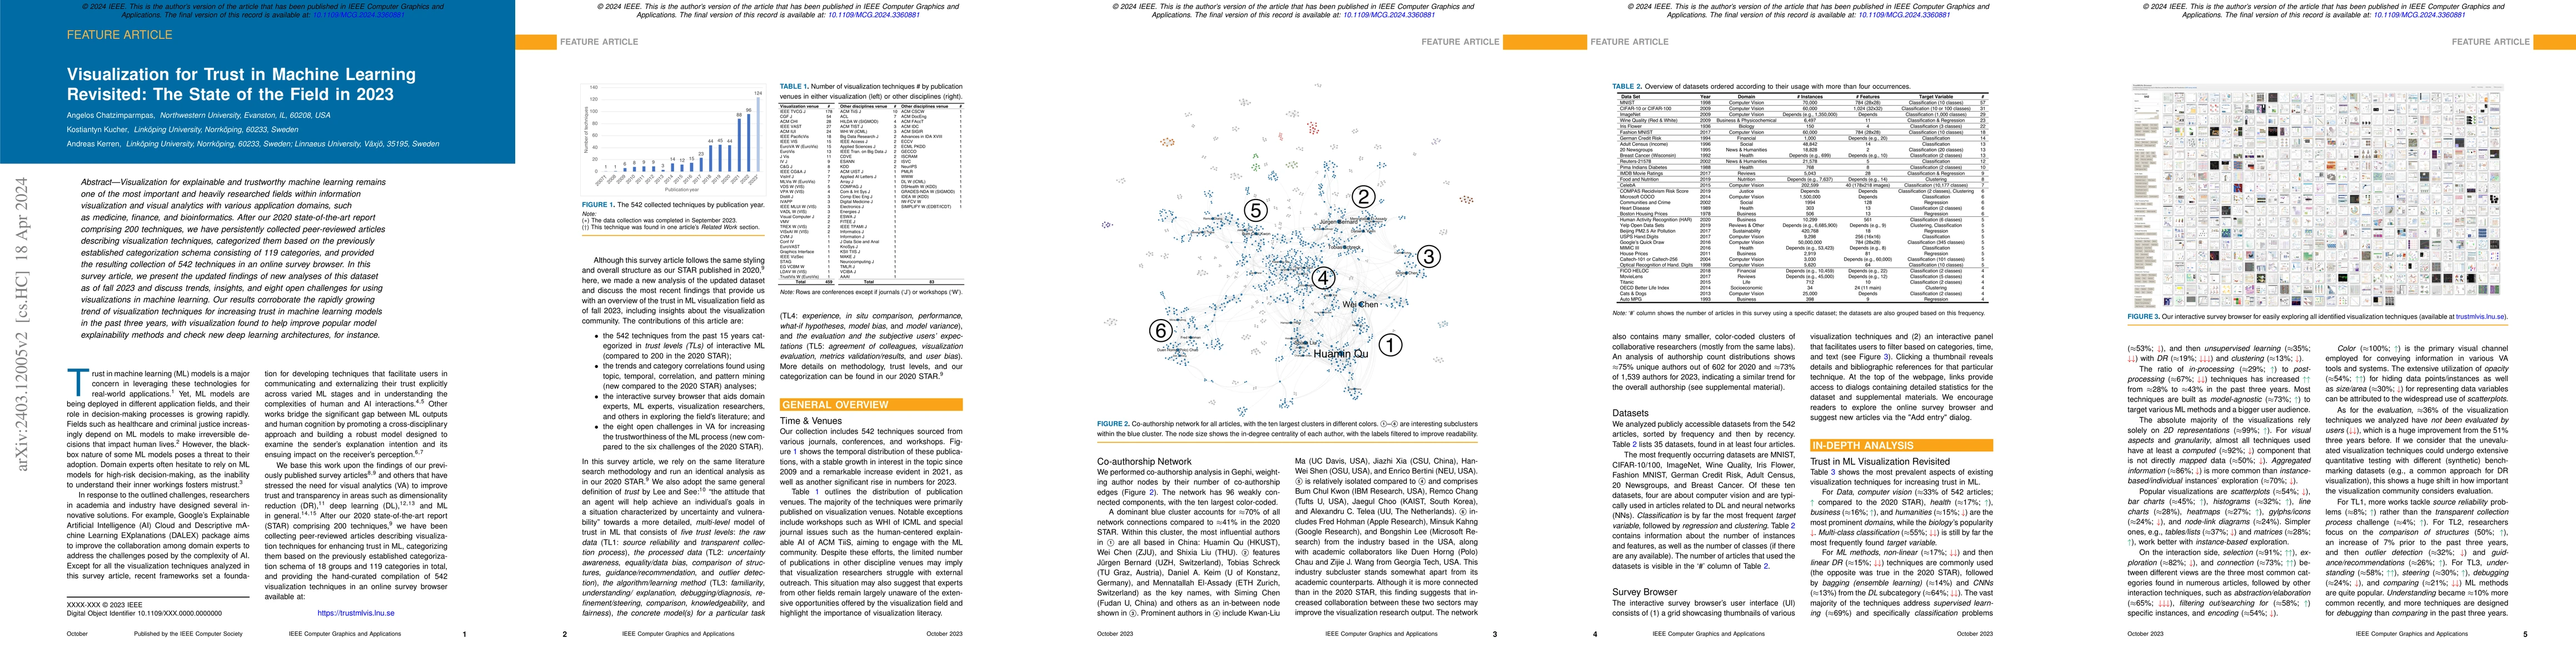
Visualization for explainable and trustworthy machine learning remains one of the most important and heavily researched fields within information visualization and visual analytics with various application domains, such as medicine, finance, and bioinformatics. After our 2020 state-of-the-art report comprising 200 techniques, we have persistently collected peer-reviewed articles describing visualization techniques, categorized them based on the previously established categorization schema consisting of 119 categories, and provided the resulting collection of 542 techniques in an online survey browser. In this survey article, we present the updated findings of new analyses of this dataset as of fall 2023 and discuss trends, insights, and eight open challenges for using visualizations in machine learning. Our results corroborate the rapidly growing trend of visualization techniques for increasing trust in machine learning models in the past three years, with visualization found to help improve popular model explainability methods and check new deep learning architectures, for instance.
AI Key Findings
Get AI-generated insights about this paper's methodology, results, significance, and more — seven facets brought into focus.
Impact
Paper Details
Authors
PDF Preview
Key Terms
Citation Network
Current paper (gray), citations (green), references (blue)
Display is limited for performance on very large graphs.
Discussion 0