Publication
Metrics
AI Quick Summary
This paper visualizes contributions to open-source projects by analyzing collaboration through provenance graphs, focusing on the 'Corona-Warn-App' in Germany. The study uses graph drawing to highlight which developers jointly modify the same files and the extent of their contributions.
Paper Preview
Abstract
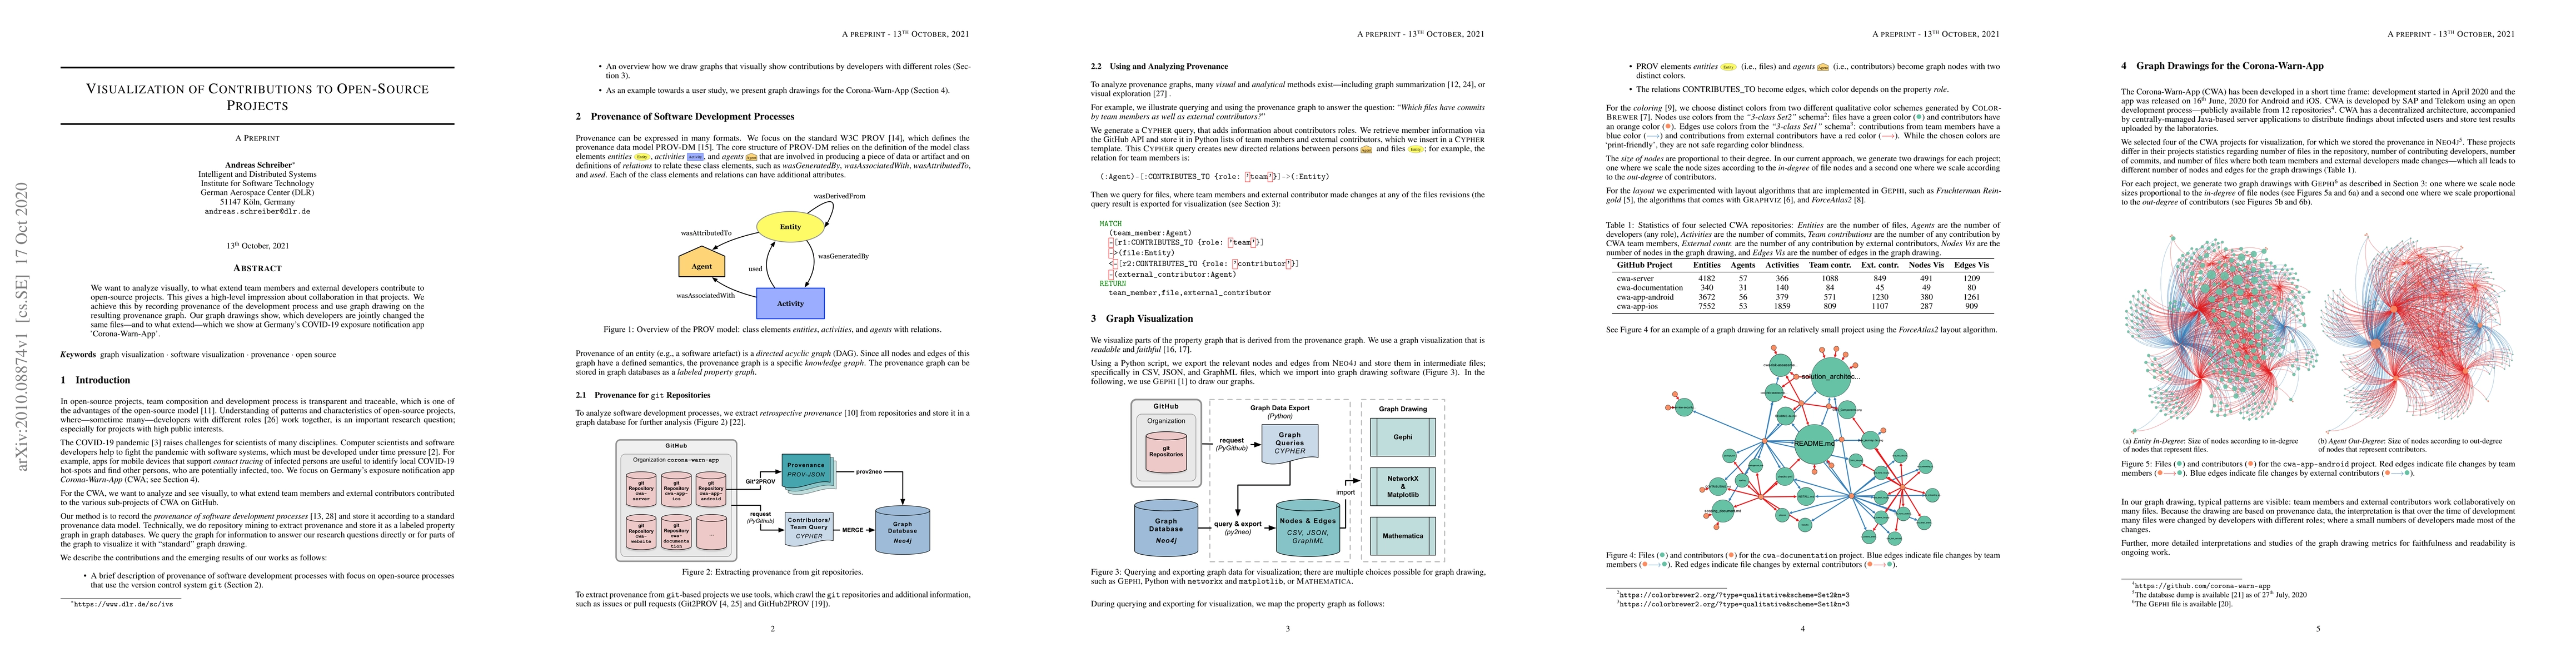
We want to analyze visually, to what extend team members and external developers contribute to open-source projects. This gives a high-level impression about collaboration in that projects. We achieve this by recording provenance of the development process and use graph drawing on the resulting provenance graph. Our graph drawings show, which developers are jointly changed the same files -- and to what extent -- which we show at Germany's COVID-19 exposure notification app 'Corona-Warn-App'.
AI Key Findings
Get AI-generated insights about this paper's methodology, results, significance, and more — seven facets brought into focus.
Impact
Paper Details
Authors
PDF Preview
Key Terms
Citation Network
Current paper (gray), citations (green), references (blue)
Display is limited for performance on very large graphs.
Discussion 0