Visualization of Data from Integral Field Spectroscopy and the P3d Tool
Publication
Metrics
AI Quick Summary
This paper explores the visualization of complex data from Integral Field Spectroscopy, focusing on the P3d tool as a solution for effectively presenting this data in astronomy. The discussion highlights the requirements and benefits of using advanced visualization tools for interpreting such intricate astronomical observations.
Paper Preview
Abstract
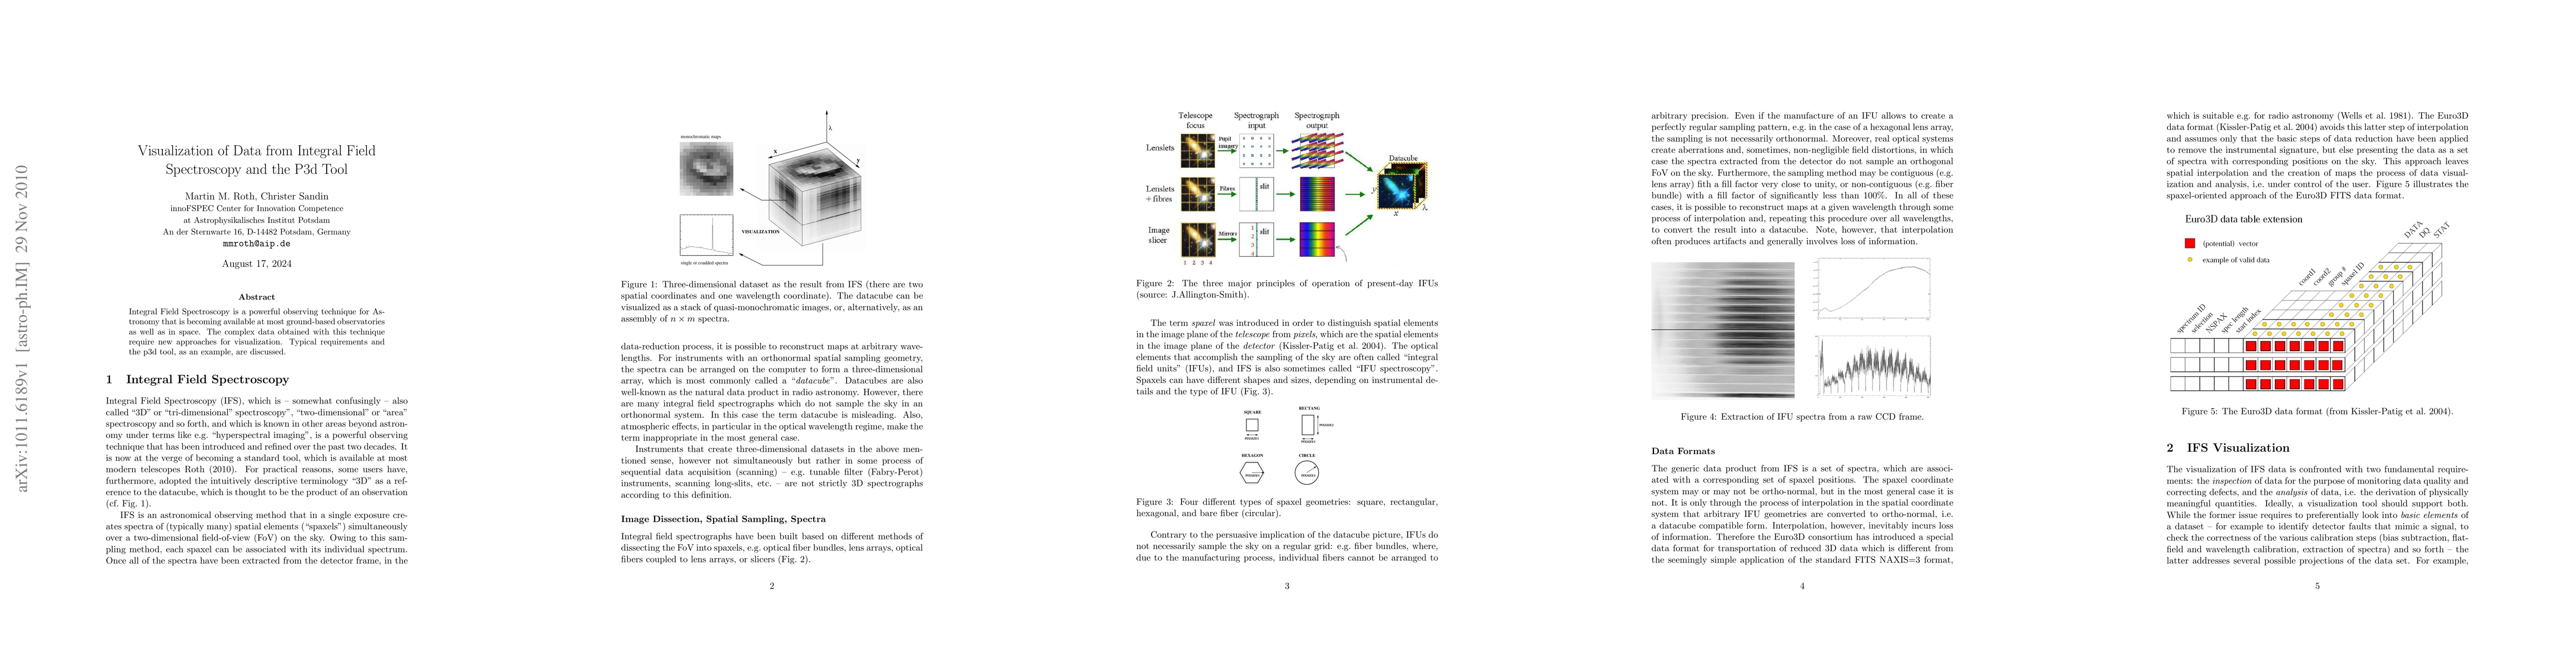
Integral Field Spectroscopy is a powerful observing technique for Astronomy that is becoming available at most ground-based observatories as well as in space. The complex data obtained with this technique require new approaches for visualization. Typical requirements and the p3d tool, as an example, are discussed.
AI Key Findings
Get AI-generated insights about this paper's methodology, results, significance, and more — seven facets brought into focus.
Paper Details
PDF Preview
Key Terms
Related Papers
No references found for this paper.
Discussion 0