Visualization of Decision Trees based on General Line Coordinates to Support Explainable Models
Publication
Metrics
AI Quick Summary
This paper introduces SPC-DT, a novel visualization method for Decision Trees using Shifted Paired Coordinates to enhance interpretability. It provides insights into attribute relations, individual case placements, data flow, split tightness, and case density, aiding domain experts in model evaluation and improvement.
Paper Preview
Abstract
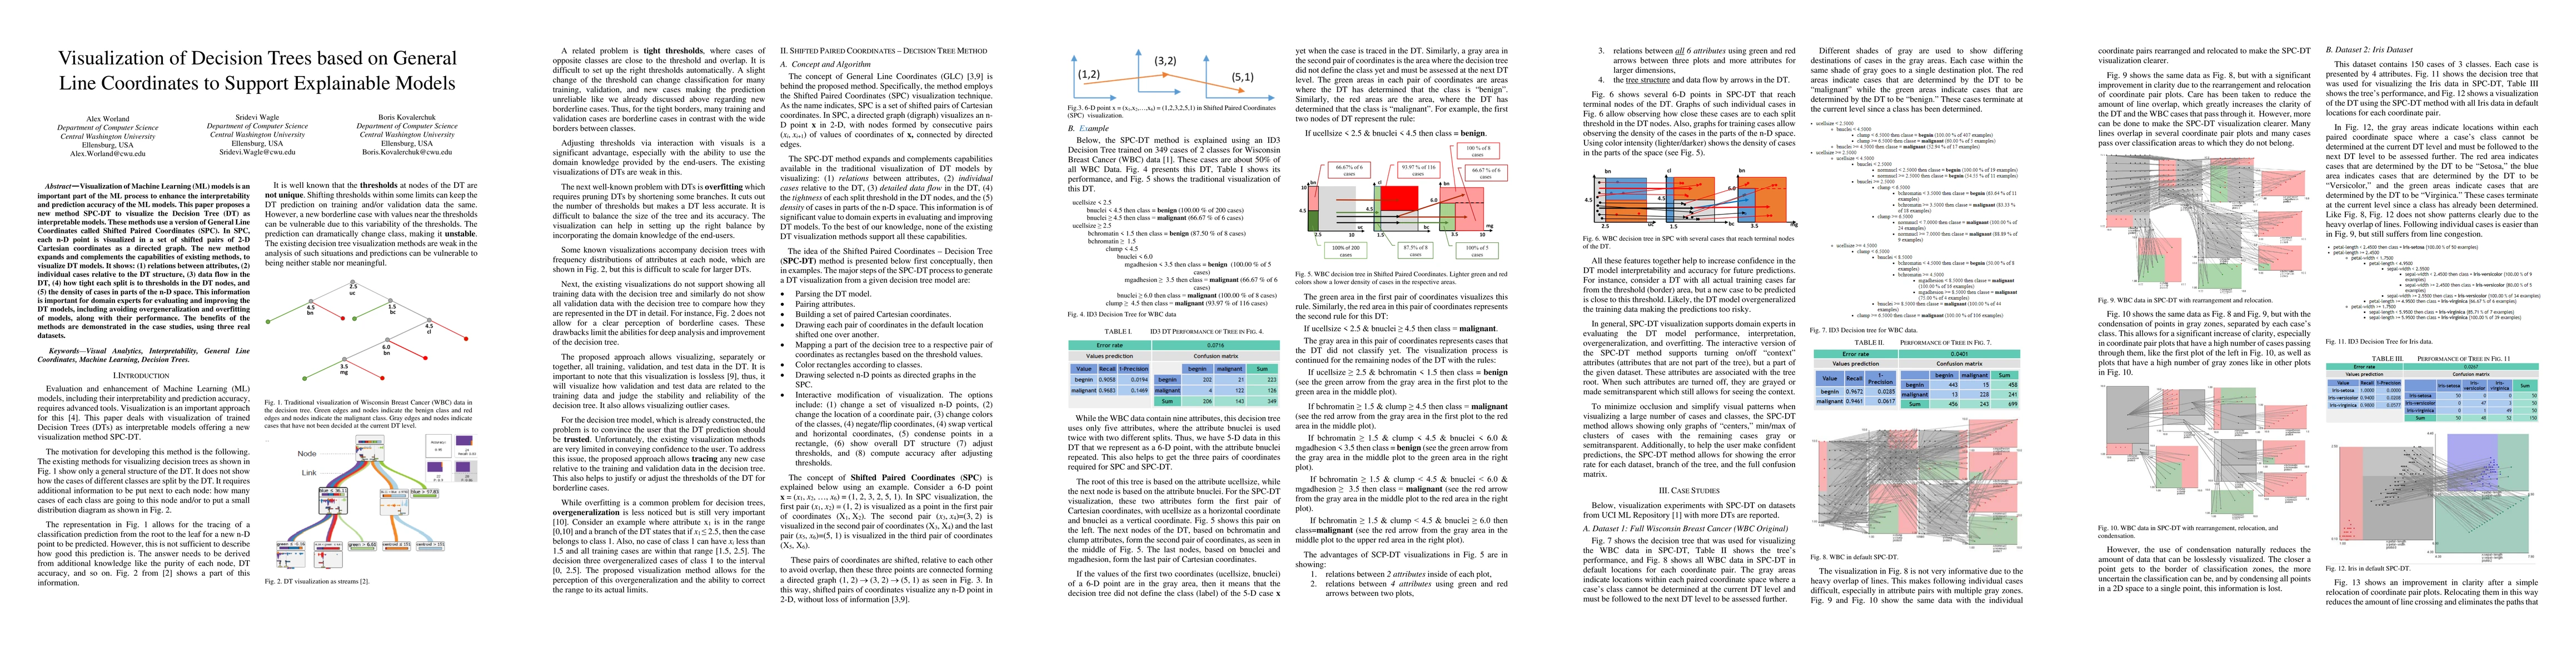
Visualization of Machine Learning (ML) models is an important part of the ML process to enhance the interpretability and prediction accuracy of the ML models. This paper proposes a new method SPC-DT to visualize the Decision Tree (DT) as interpretable models. These methods use a version of General Line Coordinates called Shifted Paired Coordinates (SPC). In SPC, each n-D point is visualized in a set of shifted pairs of 2-D Cartesian coordinates as a directed graph. The new method expands and complements the capabilities of existing methods, to visualize DT models. It shows: (1) relations between attributes, (2) individual cases relative to the DT structure, (3) data flow in the DT, (4) how tight each split is to thresholds in the DT nodes, and (5) the density of cases in parts of the n-D space. This information is important for domain experts for evaluating and improving the DT models, including avoiding overgeneralization and overfitting of models, along with their performance. The benefits of the methods are demonstrated in the case studies, using three real datasets.
AI Key Findings
Get AI-generated insights about this paper's methodology, results, significance, and more — seven facets brought into focus.
Impact
Paper Details
Authors
PDF Preview
Key Terms
Citation Network
Current paper (gray), citations (green), references (blue)
Display is limited for performance on very large graphs.
Discussion 0