Publication
Metrics
AI Quick Summary
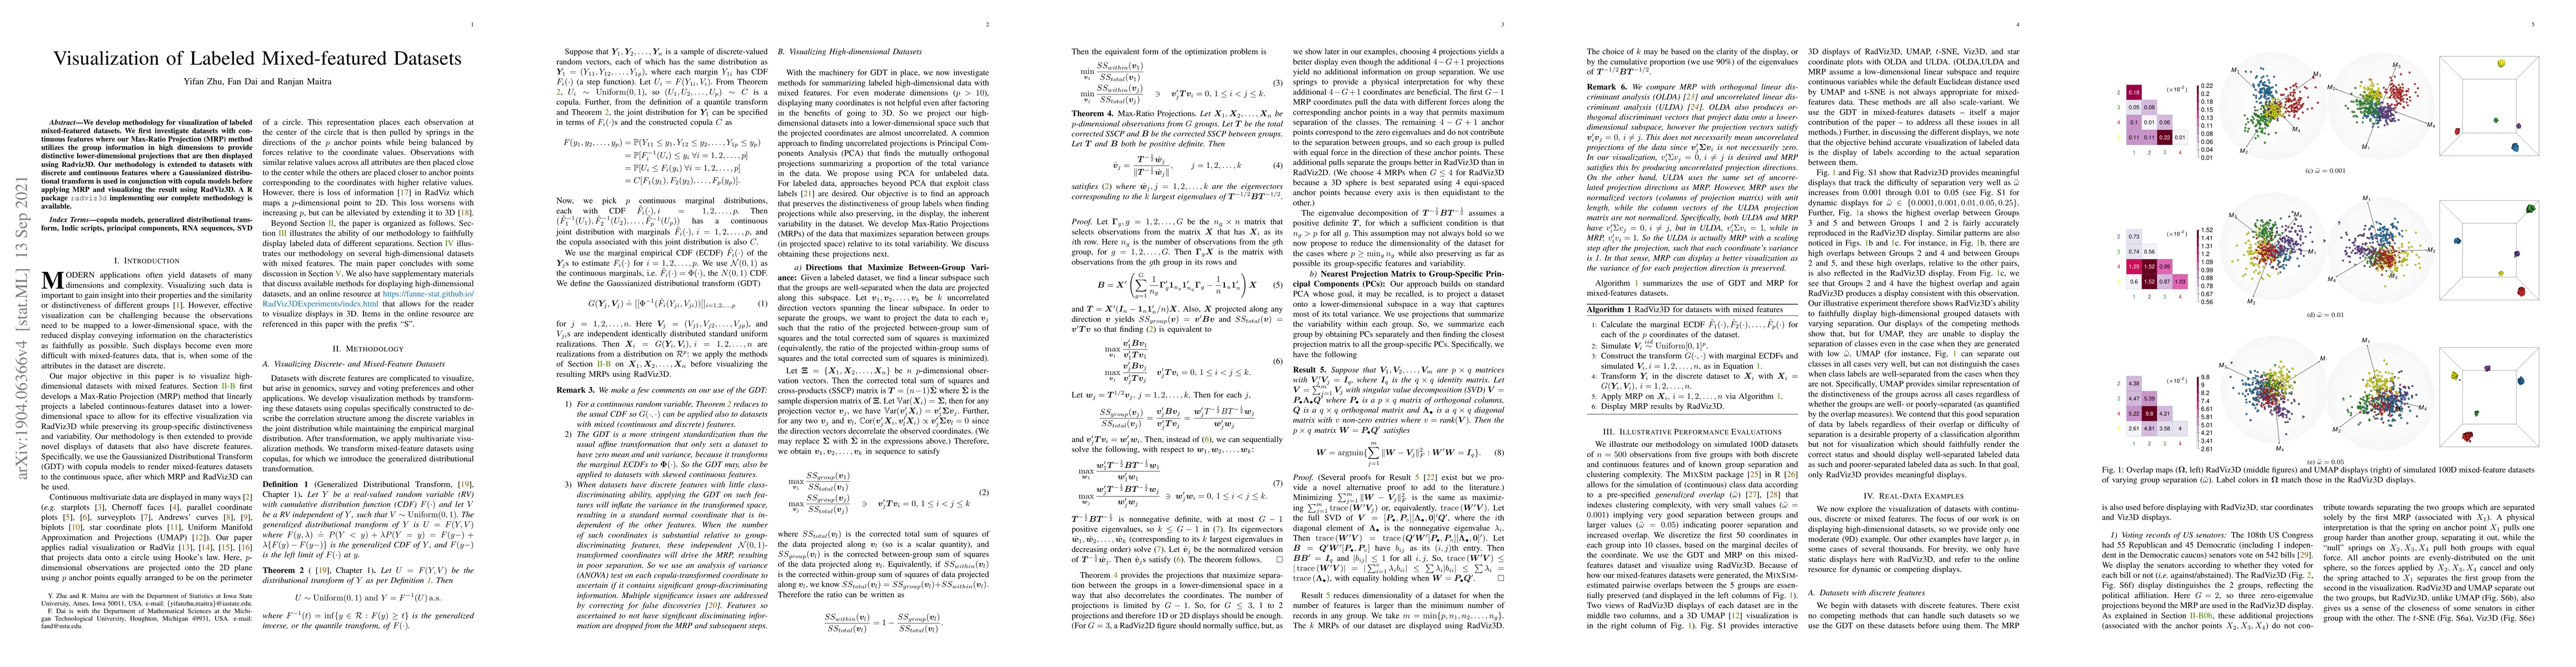
This research introduces a methodology for visualizing labeled mixed-featured datasets using Max-Ratio Projection (MRP) and Radviz3D. It extends the approach to handle both continuous and discrete features through Gaussianized distributional transforms and copula models, with a complete implementation available in the R package radviz3d.
Paper Preview
Abstract
We develop methodology for visualization of labeled mixed-featured datasets. We first investigate datasets with continuous features where our Max-Ratio Projection (MRP) method utilizes the group information in high dimensions to provide distinctive lower-dimensional projections that are then displayed using Radviz3D. Our methodology is extended to datasets with discrete and continuous features where a Gaussianized distributional transform is used in conjunction with copula models before applying MRP and visualizing the result using RadViz3D. A R package $radviz3d$ implementing our complete methodology is available.
AI Key Findings
Get AI-generated insights about this paper's methodology, results, significance, and more — seven facets brought into focus.
Impact
Paper Details
Authors
PDF Preview
Key Terms
Citation Network
Current paper (gray), citations (green), references (blue)
Display is limited for performance on very large graphs.
Discussion 0